The 2009 European Elections Confirmed the Supremacy of the Right in the EU
Turnout was down once again
The right was the clear winner
There was no “green wave”
Crisis of capitalism, failure of the far left
During the economic crisis, the protest vote is on the right
Eurosceptics trapped in the doldrums
Appendices
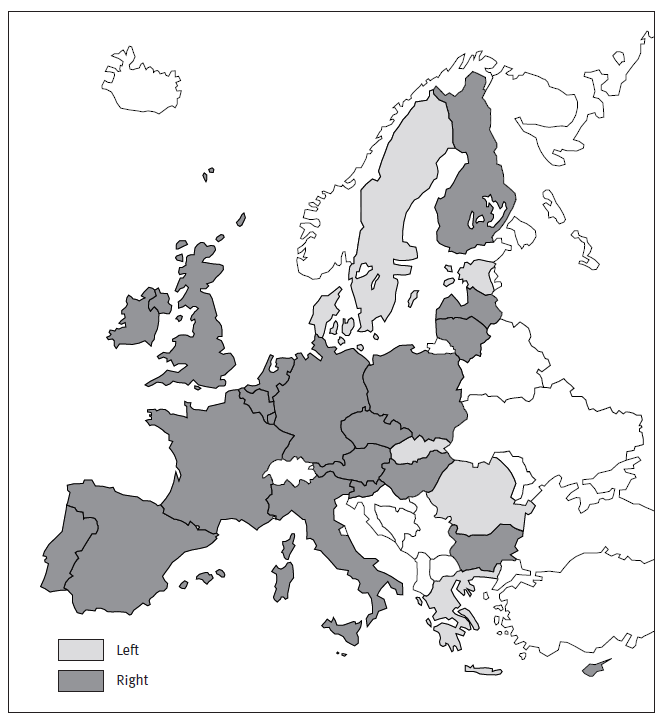
Rightwing parties won the seventh European elections, held between 4 and 7 June 2009, in 20 of the 27 European Union member states. The left topped the polling in seven countries: Slovakia, Estonia, Denmark, Greece, Romania, Malta and Sweden.
Turnout was down once again
The 2009 European election data used in this article were taken from the European Parliament website: http://www.europarl.europa. eu/parliament/archive/elections2009/en/index_en.html.
R. Laffranque, University of Tartu, blog (in French): http://Estonie-au-quotidien.over-blog.com.
Turnout fell once again in the 2009 European elections, the first held concurrently in the 27 member states. It averaged 43% across the EU,1 2.7 points less than in 2004 but nevertheless more than predicted by opinion polls (see Chart I: Turnout in European elections [1979-2009]). The overall number is worth a closer look. For the 15 oldest EU members, turnout totalled 47%, 2.1 points less than in 2004. It held steady at a high level (90.4%) in Belgium, and was high in Luxembourg as well (90.7%), where it edged down by 0.7 points. Voting is compulsory in both these countries. Turnout was stable in Germany (43.3%) and increased by nearly1 point in Finland (40.3%) and Spain (44.9%). It advanced by 11.6 points in Denmark (59.5%), where a referendum on the order of the succession to the throne was held on the same day, and by 7.7 points in Sweden (45.5%). By con- trast, it was down heavily in two countries: Italy (-6.7 points to 65%), despite the fact that local elec- tions were held in part of the country on the same day, and Greece (-10.6 points to 52.6%), which is in the throes of a serious political crisis.
The situation was different in the 12 states that joined the EU in 2004 and 2007. Turnout totalled 28.6% in Central and Eastern European countries, Cyprus and Malta, virtually unchanged compared with the previous elections in 2004 (+1 point), in which Bulgaria and Romania did not take part. This implies that the length of time since EU accession and the return of democracy are key factors in turnout in European elections. As was the case five years ago, Malta can lay claim to having the most civic-minded citizens, with turnout coming to 78.8%, although this was a 3.6-point decline compared with 2004. Next came Latvia, where turnout was up 12.4 points at 53.7%, and Estonia, where it advanced by 17.1 points to 43.9%. It should be noted that European elections are the only ones in which Latvia’s Russian-speaking community, which does not possess Latvian citizenship and is therefore not eligible to vote in national elections, is allowed to take part. In Estonia, the advent of online voting helped bolster turnout: 14.9% of voters cast their ballots on the Web.2 The severe socioeconomic and political crisis prevailing in Estonia was another factor prompting voters to want to make themselves heard.
Turnout edged up in Poland (+3.6 points to 24.5%) and Slovakia (+2.6 points to 19.6%), the two countries in which it was lowest in 2004. It held steady in the Czech Republic, despite president Václav Klaus’s call for voters to abstain, and Slovenia. It was down slightly in Hungary (-2.2 points to 36.3%), and more heavily in Cyprus (-13.1 points to 59.4%). Voting is compulsory in Cyprus, but the government had said that abstaining voters would not be fined. Turnout plummeted in Lithuania (-27.3 points to 21%), where it was the third time voters had been called to the polls in eight months (legislative elections in October 2008 and presidential elec- tion on 17 May 2009). In 2004, the European elec- tions coincided with the first round of Lithuania’s presidential election.
Growing indifference to European elections should not be interpreted as a lack of interest in Europe. Eurobarometer surveys consistently put Central and Eastern European countries, where turnout was the lowest, at the top of the list in terms of satisfaction about EU membership and desire for closer European integration. Low turnout is more the reflection of the crisis in representative democracy, and should be seen in the light of trends observed in national elections in various EU countries over recent years. Turnout for national elections is dwindling in a large majority of the 27 EU countries.
Four conditions are necessary for elections to be a success: the stakes must be clear, rules need to the same everywhere and easily understood, pluralism needs to remain within reasonable bounds and public debate needs to be polarised. None of these conditions was met in June 2009. The continued erosion of turnout poses a threat to the legitimacy of an institution whose role is increasing with time. It is therefore vital to give fresh thought to the organisation and functioning of European elections in the light of calls for greater democratisation within the Union and a “Europeanisation” of government highlighted by opinion surveys.
The right was the clear winner
Centre-left parties – i.e. Social Democrats and their affiliates – took 29.2% of the vote at the June 2009 European elections across the EU as a whole. This was by far their lowest score since the first elections to the European Parliament in 1979, and compared with a score of 33.3% in the previous elections in 2004. Support for the centre left in European elections peaked at 39.3% in 1989, and has been falling ever since. Adding together the scores of the centre left and the far left, i.e. votes won by leftwing lists across the board, we obtain a total of 32.1%, again the lowest score since 1979. If we add votes won by Green parties – which is to assume that all Green voters are supporters of the left, which is certainly not the case – we get a grand total of 37.7% of votes cast in 2009.
On the other side of the political spectrum, the centre right’s 2009 score of 44.5% represented a substantial improvement on its 2004 result of 39.2%, but was nevertheless short of its best-ever score of 51.1% in the first European elections in 1979. In 2009, the right won a clear majority of 51.1% if we add together all votes won by rightwing parties, i.e. including votes that went to the far right (see Table I: Results of European elections by party [1979-2009]).
Of the seven direct elections to the European Parliament, the left only won more votes than the right in 1989 (49% vs 44.8%). But the 1989 excep- tion is built on very shaky ground, as it includes votes for Green parties in the left’s tally. Stripping out the Green vote leaves the left with a score of only 37.7% in 1989, putting it once again behind the right (see Table I).
The extension of the European electorate brought about by enlargement had only a marginal effect (Chart II: Change in the number of voters casting a ballot in European elections [1979-2009]). If we isolate votes cast in the former EU15 countries in 2009, support for the left totals 34%, while the right was favoured by 50.4% of voters. Paradoxically, the right’s total was a bit lower in the EUR15 countries, where the far right enjoyed stronger support (8% as opposed to 6.6%). The far left was no stronger in the EU15 (3.4%) than in the EU27 (2.9%).
Since 1979, the gap between support for the left (without the Greens) and support for the right has averaged 11 points, to the advantage of the right. It reached an all-time high of 19 points in 2009.
The right won the voting in 11 of the countries in which it is currently in power. In Germany, Chancellor Angela Merkel’s Christian Democratic Union (CDU) took 30.7% of the vote, 10 points ahead of the Social Democratic Party (SPD). The other rightwing party, the Free Democratic Party (FDP), increased its 2004 score by 4.8 points to 11%. In France, president Nicolas Sarkozy’s Union for a Popular Movement (UMP) took 27.8% of the vote, beating the Socialist Party (PS) by 11.3 points. In Finland, the two rightwing parties that form the governing coalition – the National Coalition Party (KOK) and the Centre Party (Kesk) – took 23.2% and 19% of the vote respectively, compared with 17.5% for the Social Democratic Party (SDP), its worst score in any election since 1962. In Italy, Prime Minister Silvio Berlusconi’s People of Freedom Party (PDL) failed in its goal of winning 40% of the vote, but nevertheless emerged as the clear winner, with a score of 35.2%, compared with 26.1% for the Democratic Party (PD). In the Netherlands, Prime Minister Jan Peter Balkenend’s Christian Democratic Appeal (CDA) took 20% of the vote, beating its coalition partner, the Labour Party (PvdA), by 8 points. In Luxembourg, outgoing Prime Minister Jean-Claude Juncker’s Christian Social People’s Party (CSV) topped the polling with 31.3% of the vote, compared with 19.4% for the Socialist Workers’ Party (LSAP), and also won the legislative elections held on the same day. In Poland, Prime Minister Donald Tusk’s Civic Platform (PO) thrashed its rivals, taking 44.4% of the vote. (Law and Justice [PiS], another rightwing party led by president Lech Kaczyński, came second, with 27.4% of the vote.) In Lithuania, government leader Andrius Kubilius’s Homeland Union-Christian Democrats (TS-LK) won 26.8% of the vote (8.2 points more than the Social Democratic Party, LSDP). In Ireland, Fine Gael (FG) took 29.1% of the vote. In Belgium, the Christian Democratic and Flemish Party (CD&V) took the lead at the national level with 14.4% of votes cast. It was followed by another rightwing party, the Flemish Liberals and Democrats (Open VLD), with a score of 12.7%. Lastly, in the Czech Republic, the Civic Democratic Party (ODS) took 31.4% of the vote, well ahead of the Social Democratic Party (CSSD), with 22.4% (see Table II: The five highest scores recorded by centre- right parties in the 2009 European elections).
The right also won in eight countries that currently have leftwing governments. In Austria, the People’s Party (ÖVP) won 30% of the vote, beating its coalition partner, Chancellor Werner Faymann’s Social Democratic Party (SPÖ), by 6.3 points. In Hungary, the Alliance of Young Democrats (Fidesz), allied with the Christian Democratic People’s Party (KDNP), literally thrashed the governing Socialist Party, with a 39-point lead and 56.3% of the vote. In Spain, People’s Party (PP) leader Mariano Rajoy won his first electoral victory, with 42.2% of the vote. In Portugal, voters confounded opinion pollsters by giving the rightwing Social Democratic Party (PSD) 31.7% of the vote. In Bulgaria, Citizens for the European Development of Bulgaria (GERB) took 24.3% of the vote. In Slovenia, the opposition Democratic Party (SDS) won the poll with a score of 26.9%. In the United Kingdom, the Conservative Party (Cons) won 27% of the vote, beating Prime Minister Gordon Brown’s Labour Party by 11.7 points. In Cyprus, the Democratic Rally (DISY) took 35.6% of the vote, 0.7 points more than president and Prime Minister Demetris Christofias’s Progressive Party of Working People (AKEL) (see Table III: The five highest scores recorded by centre-left parties in the 2009 European elections).
The seventh European elections were also characterised by the weakness of the protest vote. While the governments of 20 countries were the victims of protest votes in the 2004 poll, only 12 lost majority support in 2009: four on the right (Greece, Malta, Denmark, Estonia) and eight on the left (Hungary, Austria, Portugal, Spain, United Kingdom, Slovenia, Bulgaria and Cyprus). The only country where a leftwing government won the election was Slovakia (see Table IV: Protest votes in the 2009 European elections; see Map I: Political hue of national governments prior to the 2009 European elections; see Map II: Political hue of the winners of the 2009 European elections).
There was no “green wave”
Source: id., ibid.
Source: C. Deloy and D. Reynié, Les élections européennes de juin 2004, Paris, PUF, 2005
Available on: http://ec.europa.eu/public_opinion/ archives/eb/eb70/eb70_annex.pdf.
Source: Deloy and D. Reynié, Les élections européennes de juin 2004, op. cit.
Source: , ibid.
When voting closed on 7 June 2009, the scores of a few Green parties, particularly in France, gave the impression that a Green electoral wave had just submerged the continent. In the end, the “wave” turned out to be fairly small, the Greens having only achieved particularly high scores in Luxembourg (16.8%), France (16.3%) and Belgium (13.5%). The fact that these three countries were among the founding members of the EU and that they are the home to most of the Union’s institutions may go part of the way towards explaining why commentators read a widespread trend into these three results.
There is no doubt that public opinion is placing increasing importance on environmental concerns and sustainable development issues. This type of concern emerges most clearly within the framework of the Union, most people interviewed believing that transnational governments are better placed to act effectively in this area. Eurobarometer surveys show that environmental protection is a priority for European citizens, while environmental issues (climate change, energy, etc.) have for some years been among the three main areas in which European citizens would like to see the EU take charge. That said, in the year leading up to the elections, the economic crisis tilted the order of priorities in favour of social issues. This is doubtless one of the main reasons behind the absence of a green wave.
The Greens got their highest scores in Luxembourg, France and Belgium. In Luxembourg, the Greens (G) won 16.8% of the vote, a high score and an increase of nearly 2 points on their performance in 2004. In France, the Europe Ecology coalition won 16.3% of the vote by adding candidates from the far left (such as José Bové), associations (Karima Delli) and civil society (Eva Joly) to the list presented by the Greens, which are on the left of France’s political spectrum. Europe Ecology’s score was nearly 9 points higher than that of the Greens alone in 2004.3 In Belgium, Ecolo scored 22.8% among French-speaking voters and 15.5% among German-speaking voters, respectively 13 and 5 points more than in the previous election in 2004.4 Among Dutch-speaking voters, Green! took 7.9% of the vote, the same score as in 2004. It is also worth noting that voting is compulsory in Belgium and Luxembourg, meaning that it is impossible to make a true comparison based on the percentage of votes cast. It is impossible to say, for instance, how much the Greens would have scored in France had voting been compulsory there; similarly, no one knows how much support they would have won in Belgium or Luxembourg if voters had been free to abstain.
The left is in a similar predicament in each of these three countries. In France, the Socialist Party looks disoriented after defeats in three successive presidential elections (1995, 2002 and 2007). It is undermined by significant internal divisions, the absence of alternative policies and a leadership vacuum. Belgium’s Socialist Party, led by Elio Di Rupo, has been caught up in a series of political and financial scandals since 2005. In the most recent legislative elections in June 2007, the Belgian Socialist Party lost its status as Walloon’s pre-eminent political party for the first time in its history. In France, as in Belgium, the Socialists’ woes undeniably gave the Greens a boost. In Luxembourg, the LSAP, which has been the coalition partner of Jean-Claude Juncker’s CSV since 2004, was unable to convince voters that it could offer a veritable solution, with most Luxembourg citizens citing the fight against unemployment, Europe’s policy in favour of employment and social questions as the three main issues in the 2009 European elections. The LSAP (19.4%) beat the Greens by only 3 points in Luxembourg.
The Greens remained a strong force in the northernmost part of Europe. Opinion surveys regularly highlight the importance of environmental issues for people living in the Nordic countries. According to the latest Eurobarometer survey (EB70, autumn 20085), 19% of Swedes and 12% of Finns cite the protection of the environment as one of the top two issues facing their country, compared with an average of 4% in the EU as a whole, where the effects of the economic crisis were starting to make themselves felt. Compared with the 2004 poll,6 the Greens improved their score in Finland (+2 points to 12.4%) and Sweden (+5 points to 11%).7 The Greens also improved their score in the United Kingdom (+2.5 points to 8.4%) and the Netherlands (+1.5 points to 8.9%). In Germany (12.1%), their score was unchanged compared with 2004. Lastly, they lost ground in Austria (-3 points to 9.9%) and Ireland (losing more than 3 points to 1.1%).
By contrast, the Greens are virtually non- existent to the east of a line between Rome and Tallinn, except in Poland, where their modest score of 2.4% represented a gain of 2 points compared with 2004, and in Greece, where they made substantial headway (3.4%, up from 0.6% in 2004). Elsewhere, the Green vote does not yet exist, or fell sharply, as in Slovenia (0.6%, down more than 1.5 points), Cyprus (1.5%), Slovakia (2.1%), Hungary (2.6%) and Estonia (-1 point to 3%). In the Czech Republic, the Greens took 2% of the vote, down 1 point compared with 2004, possibly because of the participation of their leader, Martin Bursík, in the government of Mirek Topolánek as Minister for the Environment from 2007 to 2009. Martin Bursík resigned his party’s leadership after the European elections. In Malta, support for the Greens of Democratic Alternative (AD) took a 7.5-point dive to 2.3%.
Across the Union, the Green vote represented 5.6% of the vote, an increase compared with the first European elections in 1979 (1.7%), but nevertheless short of the all-time high of 7.6% in 1989, the only instance in which lef- twing parties scored higher than the right in any European election. Over the last 20 years, the Green vote has remained steady at between 5% and 6%. In 2009, it actually edged down compared with 2004.
The increasing abstention in European elections over the last 30 years needs to be seen in this light. The decline in turnout exacerbates the structural disadvantage of the Greens, who are no more successful than other parties in persuading voters to take part in elections to the European Parliament, despite the fact that voters overwhelmingly believe that the transnational level is the most pertinent in respect of environmental issues.
Ecology has no doubt become too important an issue and, at the same time, too widespread a concern for Green parties to be the only forces apt to defend and promote it. Over time, the increasing weight of the environmental cause has de-specialised it. No party hoping to win government can allow itself to go before voters without a sound environmental plank in its platform. But ecology is not everything, and Green parties have so far been unable to set out policies on the other big issues of concern to voters. The spread of interest for ecology and the ecologists’ incapacity to broaden their vision constitute a two-pronged limit to their political – and electoral – progress.
Crisis of capitalism, failure of the far left
Source: id., ibid.
We know that the far left does not really thrive in the heat of electoral battles, but European elections, because of their voting system, give them more of an advantage than other types of polls. This is why the various far-left organisations regularly field candidates. Their results are therefore worthy of attention.
If we accept the widely held belief that the crisis of capitalism that we are currently experiencing is the worst the world has known for 80 years, we must acknowledge that governments have fulfilled their role of political and social regulation (as is shown clearly by the state of public finances in EU countries). The 2009 European elections showed that the far left does not derive any benefit whatsoever from crises of this nature.
Twenty years after the collapse of communism, we can also take this as the latest in a series of crises not marked by the resurgence of the radical left, inevitably trapped in the reference to communism. Granted, the far left notched up its best performance in all European elections in 2009, but its score was nonetheless very low: 2.9% of votes cast across the EU as a whole. If we factor in the increase in abstention, we see that the number of people voting for the far left actually declined. The far left is still only a marginal electoral force in Europe. Social Democrats have grasped the message everywhere except France (see Table VI: Results of far-left parties in European elections [1979-2009]).
The far left can only claim to have a significant presence in 9 of the 27 EU member states, and its score only topped 10% in Ireland and Portugal. In Ireland (11.2%), it owes its success to the Sinn Féin (which means “ourselves” in Gaelic), which increased its score by nearly 3.5 points compared with 2004. In Portugal, the Left Bloc (BE) took 10.7% of the vote, an increase of more than 5 points. In Luxembourg, The Left (L) doubled its 2004 score, but only won 3.4% of the vote, while the Communist Party (KPL) remained stuck in the doldrums (1.5%). In France, the New Anticapitalist Party (NPA) took 4.9% of the vote, while Workers’ Struggle (LO) won 1.2%. Together, the two parties took 6% of votes cast, an increase of 3 points compared with 2004.8 Despite this, the New Anticapitalist Party failed on this occasion to achieve its goal of outscoring the Revolutionary Communist League (LCR), from which it was born.
In the Netherlands, the Socialist Party (SP) maintained its previous score (7.1%), while support for the populist right advanced strongly. In Greece, the unrest seen in the months leading up to the election, which at times verged on the preinsurrectional, benefited neither the Communist Party, one of the few remaining influential communist parties in Europe, nor the radical left. The Greek Communist Party (KKE) won 8.3% of the vote, 1 point less than in 2004. The Coalition of the Radical Left (Synaspismos) won an honouable score of 4.7%, but its support was down compared with 2004 (-0.5 points). In Finland, the Left Alliance (VAS) took 5.9% of the vote, down from nearly 10% in previous elections. En Sweden, the Left Party (VP) lost more than 7 points (5.6%). In Poland, support for Samoobrona (SO) fell by more than 9 points to 1.4%.
During the economic crisis, the protest vote is on the right
Source: id., ibid.
Source: id., ibid.
Source: C. Deloy, “The two major parties severely punished by the Austrians, the far right on the rise”, Fondation Robert-Schuman, 2008
Source: , ibid.
Source: C. Deloy and D. Reynié, Les élections européennes de juin 2004, op. cit.
Source: , ibid.
Source: , ibid.
Source: C. Deloy and M. Lupaescu, “Victory in num- bers of votes for the Social Democratic Party; but victory in terms of seats for the Democratic Liberal Party led by President of the Republic Traian Basescu in the Romanian parliamentary elections”, Fondation Robert-Schuman, 2008.
Source: Deloy and D. Reynié, Les élections européennes de juin 2004, op. cit.
Source: id., ibid.
Source: id., ibid.
The far right fielded big lists in 19 EU countries in the 2009 European elections. Far-right parties generally score two to three times more than far-left parties in elections to the European Parliament. This was once again the case in 2009, even though we noted a fall in the number of votes for the far right in the EU as a whole (-1.5 points) compared with 2004 (see Table IV: Table IV: Protest votes in the 2009 European elections).9
The far right’s performances in some countries held out the prospect of a resurgence of support, although this is not yet manifest throughout the EU. Far-right parties polled particularly well in eight countries: Belgium (21.8%), adding together the results of four parties (Vlaams Belang, VB; National Front, FN; New Flemish Alliance, N-VA; and List Dedecker, LDD); Austria (17,3%), adding together the results of two rival parties (Freedom Party of Austria, FPÖ; and Alliance for the Future of Austria, BZÖ); the Netherlands (17%); Denmark (14.8%); Hungary (14.8%); Finland (14%), where True Finns joined forces with the Christian Democrats; Bulgaria (11.9%); and Italy (10.2%).
In the Netherlands, national MP Geert Wilders made his Party for Freedom (PVV) the country’s second-largest political party (17%). He campaigned against the European Union, arguing against the possible integration of Turkey and stigmatising the “Islamisation of Dutch society”. For several years, the Dutch have seized successive elections as an opportunity to express their discontent. Known for their tolerance and their inclusiveness, the Dutch have been experiencing a profound identify crisis, giving the impression of being more divided than ever. In 2002, Pim Fortuyn’s emergence on the political scene rocked the country and started breaking down the consensual political system built up over previous decades. “The Netherlands are full”, he once said. Fortuyn’s programme was focused on stopping immigration and banishing Islam, which he described as a “backward culture”.
In Belgium, the far right also benefited from the political and institutional crisis in which the country is currently embroiled: it took more than six months for a government to be appointed following the June 2007 legislative elections. Nationally, the far-right vote is split between four rival parties: Vlaams Belang (10.9%), New Alliance (8,2%), List Dedecker (4.5%) and the National Front (1.33%). The far right’s presence is most pronounced in Flanders, where secessionist aspirations are growing stronger. Results for the various linguistic groups are as follows. Dutch speakers: Vlaams Belang (15.9%), New Alliance (9.9%), List Dedecker (7.3%); French speakers: National Front (3.5%).
Hungary has for several years been confronted by the political activism of the far right, which has been seeking to benefit from the country’s current difficulties, both political (heightened polarisation) and economic (a massive budget deficit, which is forcing the government to keep spending down). Hit hard by the prevailing economic crisis, Hungary only avoided bankruptcy thanks to the support of the International Monetary Fund (IMF) and the European Union. The country has experienced violent riots during which rightwing militia came to the fore, in the autumn of 2006 for instance. Former Socialist Prime Minister Ferenc Gyurcsány was forced to resign three months ahead of European elections that left his Socialist Party (MSZP) on the ground (17.3%, down 17 points), thrashed by the rightwing opposition, the Alliance of Young Democrats (Fidesz-KDNP) (56.3%).10 The far-right Movement for a Better Hungary (Jobbik) was just behind the Socialist Party with 14.7% of the vote.
In Finland, the increase in support for the far right is a more longstanding electoral trend. True Finns (PS) scored well (5.4%) in the local elections held in October 2008. Opinion surveys carried out after these elections suggested that True Finns had attracted many former Social Democratic Party voters. Clearly, the Finns used the Europeans election to express their discontent again. Support for True Finns advanced strongly compared with last year’s local elections, hitting 14%, no doubt thanks to its alliance with the Christian Democrats. Party leader Timo Soini attracted more votes to his name than any other candidate.
In Austria, the far right won 17.3% of the vote if we combine votes for two rival parties, the FPÖ and the BZÖ. Austria’s far right has seen support swell over the last ten years. In 2000, the FPÖ was the first far-right party to join a national government in the European Union. In the most recent legislative elections (September 2008), the two parties together took 28.2% of the vote, 17.5% for the FPÖ and 10.7% for the BZÖ.11 The far right was the chief beneficiary of the collapse of the two parties that had dominated political life since the birth of the Austrian Republic in 1918. The SPÖ and the ÖVP, members of the outgoing coalition, together took only 55.1% of the vote in the last legislative elections, their lowest score ever. In the 1970s, the two parties averaged 90% of the vote. With 4.6% of the vote on 7 June 2009, the BZÖ, whose leader, Jörg Haider, died on 11 October 2008, saw a decline in its support compared with the previous national poll, in which it won 10.7% of the vote.12 To conclude, we note that Austria does not have a populist far-left party. The far right is the sole focus of the protest vote at this time.
In Denmark, the Danish People’s Party (14.8%) improved significantly on its 2004 score (+8.5 points).13 Bear in mind that while European elections tend to favour Denmark’s Eurosceptics, such as the People’s Movement against the European Union (Folk. B) and the June Movement (J), these two parties together took only 9.3% of the vote in 2009. It is therefore likely that some of these parties’ supporters ended up voting for another Eurosceptic party more firmly entrenched in the country’s national political life.
The far right made its grand entrance into Bulgarian political life in the June 2005 legislative elections, when Ataka won 8.1% of the vote.14 Bulgaria is home to a number of large minorities, but up until then had been spared the ethnic tensions that sparked wars across the Balkans after the fall of communism. Since then, support for Ataka has held steady or increased. Party leader Volen Siderov forced president Georgui Parvanov into a runoff in the 2007 presidential election. The country has been badly bruised by the economic crisis and has seen a string of antigovernment riots since the end of 2008. In power since June 2005, Socialist Serguei Stanichev does not have much latitude. He has implemented very rigorous fiscal policies, but had to give in to demands for higher pensions and civil service wages. Large swathes of the population are finding the economic transition very difficult, especially with corruption rife throughout the country. In that sense, support for Ataka can be seen as a protest against politicians across the board. On top of that, Ataka has campaigned against EU accession for Turkey, a powerful issue in a country that borders the EU hopeful and which is home to a Turkish minority that accounts for 8% of the population.
Support for the far right was up compared with 2004 in seven of the eight countries in which its score was in double figures: it gained 14 points in the Netherlands, 13.5 points in Finland, 12.5 points in Hungary, 11 points in Austria, 8.5 points in Denmark, 7.9 points in Belgium and 5 points in Italy. The sole exception was Bulgaria, where Ataka’s score was 2 points lower than in the previous European election on 20 May 2007, after the country’s accession.15
In five other countries, the far right’s score varied from 5% to 10% of votes cast. In Romania, the Greater Romania Party (PRM), which failed to win a seat in the national parliament in the November 2008 legislative elections, won 8.6% of the vote, up 5 points compared with the previous European election on 25 November 2007, after the country’s accession.16 In the United Kingdom, the British National Party (BNP) took 8.4% of the vote, a 3.5-point increase on its 2004 score, winning its first two seats in the European Parliament.17 Its virulent campaign allowed Nick Griffin’s party, along with the United Kingdom Independence Party (UKIP), to reap the benefits of a deep recession coinciding with a string of financial scandals involving politicians. The main victim of the campaign run by the far-right parties was undoubtedly the country’s leading opposition party, the Tories, which missed its target of 30% of the vote. In Greece, Popular Orthodox Rally (LAOS) emerged as the beneficiary of the political woes besetting Athens, with 7.1% of the vote, a gain of 3 points compared with 2004, in a climate marked by the economic crisis, riots and, here too, financial scandals involving politicians. On top of that, a few weeks ahead of the ballot, the majority and the opposition failed to reach an agreement about the measures needed to deal with the economic crisis. In Slovakia, the Slovak National Party (SNS) took 5.5% of the vote (+3.5 points compared with 2004). By contrast, France’s National Front (FN) scored a mediocre 6.3%, a drop of 3.5 points.18
The far right also saw its support plummet in Poland, where the various lists that took 22.8% of the vote in 200419 only managed to attract 8.9% of voters in 2009. Similarly, in the Czech Republic, the Workers’ Party (DS) and the National Party (NP) were virtually wiped out, winning just 1% and 0.2% of the vote respectively, after having run an aggressive campaign focused on the national identity and sparked a fierce controversy by talking about a “final solution for the Rom problem”.
Present in more than two-thirds of EU countries, the far right is not a homogenous force and cannot be seen as a united political movement. Geert Wilders’s PVV does not consider itself to be a far-right party and does not intend to sit with a far-right group in the European Parliament. Aware of the problem, British National Party leader Nick Griffin sought during the campaign to forge closer links to other nationalist parties, including Jobbik, the SNS, PRM – which has on several occasions sought to join the European People’s Party (PPE) – and Bulgaria’s Ataka, with a view to forming a far-right group in the European Parliament. But his efforts were in vain.
Despite their shared traits such as a dislike for the elite, opposition to immigration, reliance on a protective state in the face of the economic crisis and the defence of the national identity, far-right parties form an odd bunch. The Danish People’s Party is xenophobic but a fierce defender of the country’s “flexicurity” model; Belgium’s Vlaams Belang and Italy’s Northern League eschew the notion of national solidarity, while France’s National Front and the British National Party take precisely the opposite tack, namely the defence of the national identity, largely through the rejection of Islam. Lastly, some parties are Eurocritical, such as Bulgaria’s Ataka, while others, such as the National Front in France, just want their country to get out of the European Union.
Eurosceptics trapped in the doldrums
The seventh European elections were another failure for Eurosceptics, whose support was down on 2004. With 3.2% of votes cast, parties that are critical of or opposed to the European Union remained on the sidelines. There is little doubt that the affirmation of the role of national governments in the response to the global economic and financial crisis undermined the arguments of sovereigntists by showing that belonging to the Union was not incompatible with a strong response at national level. Furthermore, most Europeans are firm believers in the protective role of the EU and – even more so – the euro. As the 21st century gets into full swing, the idea of going it alone is no longer a source of reassurance for many. Sovereigntist arguments prompt more scepticism than those in favour of European cooperation (see Table VIII: Results of Eurosceptic parties in European elections [1979-2009]).
The exception was Austria, where the list led by Hans-Peter Martin obtained an excellent score, which opinion polls had failed to predict. The former SPÖ MEP took 17.6% of the vote, improving his 2004 score by 4 points.20 This success occurred in a country where hostility to Europe is a feature of public opinion across the political spectrum, nourished by political parties on all sides. During the European elections, no party other than the Greens cited the benefits of EU membership for Austria during its campaign. Hans-Peter Martin received the support of Kronen Zeitung, a newspaper read daily by 3 million people, owned by Eurosceptic Hans Dichand. It was in this very same paper, on 26 June 2008, that Austria’s previous Chancellor, Alfred Gusenbauer (SPÖ), and his replacement, Werner Fayman (SPÖ), published an open letter in which they said that all modifications to the European treaties affecting Austria’s interests should be subject to referenda. In September, the SPÖ had no scruples about voting with the country’s two far-right parties (the FPÖ and the BZÖ) in favour of a bill on this very issue.
In the United Kingdom, the UKIP, which favours withdrawing from the European Union, obtained virtually the same score as in 2004 (16.5%).21 The UKIP’s second place in polling is more of a reflection of the massive defeat suffered by Labour (Lab) and the difficulties facing Prime Minister Gordon Brown than a real entrenchment of the sovereigntist party.
In Sweden and Denmark, the decline in support for Eurosceptic lists went hand-in-hand with high turnout. Turnout was up 7 points in Sweden (45.5%) and 12 points in Denmark (59.5%), which may be taken as acceptance of European integration.22 Traditionally, European elections tend to favour Eurosceptic movements, namely Denmark’s People’s Movement against the European Union (Folk. B) and June Movement (J), or Sweden’s June List (J). The People’s Movement against the European Union wishes to see Denmark leave the EU, while the June Movement, which favours continued EU membership, supports retaining Sweden’s exemption clauses with respect to economic and monetary union, foreign and security policy, police and justice. In Sweden, support for the June List fell dramatically. In 2004, it scored 14.4%, thereby becoming the country’s third-largest political force. In 2009, its support fell to 3.5%. In Denmark, the People’s Movement against the European Union and the June Movement won roughly 20% of the vote in each European election between 1979 and 1999. The decline dating back to 2004 (13%) was confirmed and compounded in the June 2009 elections (9.3%). By contrast, we note a big increase in support for the Socialist People’s Party (SF, 15.4%, +7.5 points compared with 2004).23 Previously Eurosceptical, the Socialist People’s Party has become more favourable to greater European integration over the last two years. It nevertheless continues to oppose the Common Agricultural Policy (CAP) and Sweden’s adhesion to economic and monetary union.
The most striking failure among Eurosceptic parties was that of sovereigntist party Libertas, whose stated goal is to fight for greater democracy and transparency among European institutions. Founded by Declan Ganley, an Irish entrepreneur, Libertas fielded candidates in ten EU countries: Poland, Malta, the United Kingdom, Spain, the Czech Republic, France, Estonia, Italy, Ireland and Latvia. It aimed to send a hundred MEPs to Strasbourg. Declan Ganley was himself badly beaten in North West Ireland. Ganley, who is Chairman of Rivada Networks, subsequently announced his retirement from politics and said that he would not campaign against the ratification of the Lisbon Treaty in the new referendum scheduled for 2 October 2009 in Ireland. Libertas will only have one member in the new parliament: the president of the Movement for France (MPF), Philippe de Villiers, who owes his election to his high visibility in his native region. In France, his party, the MPF, which was allied with Hunting, Fishing, Nature, Tradition (MPF-CPNT) under the Libertas banner, took 4.6% of the vote.
In the Czech Republic, the Eurosceptic Party of Free Citizens (SSO) took only 1.2% of the vote. This failure is particularly telling in that the party was founded in 2009 by a close ally of Czech president Václav Klaus, well known for an anti-Brussels stance that forced him to stand down from his post as honorary president of the Civic Democratic Party, which he deemed to pro-European.
The June European elections did not bear the marks of the economic crisis. The protest parties – which are the most hostile to the– all fared poorly, and most incumbent governments avoided falling victim to a protest vote. By contrast, the poll was a spectacular failure for the centre left, whether it be in government or in opposition. Symmetrically, the right won a clear victory, confirming a trend seen in national polls over recent years. The right is in power in two-thirds of EU countries (18 out of 27), and is undeniably the predominant force in the EU.
We must now keep an eye on results in the coming national elections to confirm the lessons of the June 2009 poll. On 5 July, the Bulgarians confirmed their 7 June vote by sanctioning Serguei Stanichev’s Socialist government and giving a majority to the right. The next important elections are Germany’s federal poll, scheduled for 27 September 2009.
Chart I: Turnout in European elections (1979-2009), as a % of votes cast
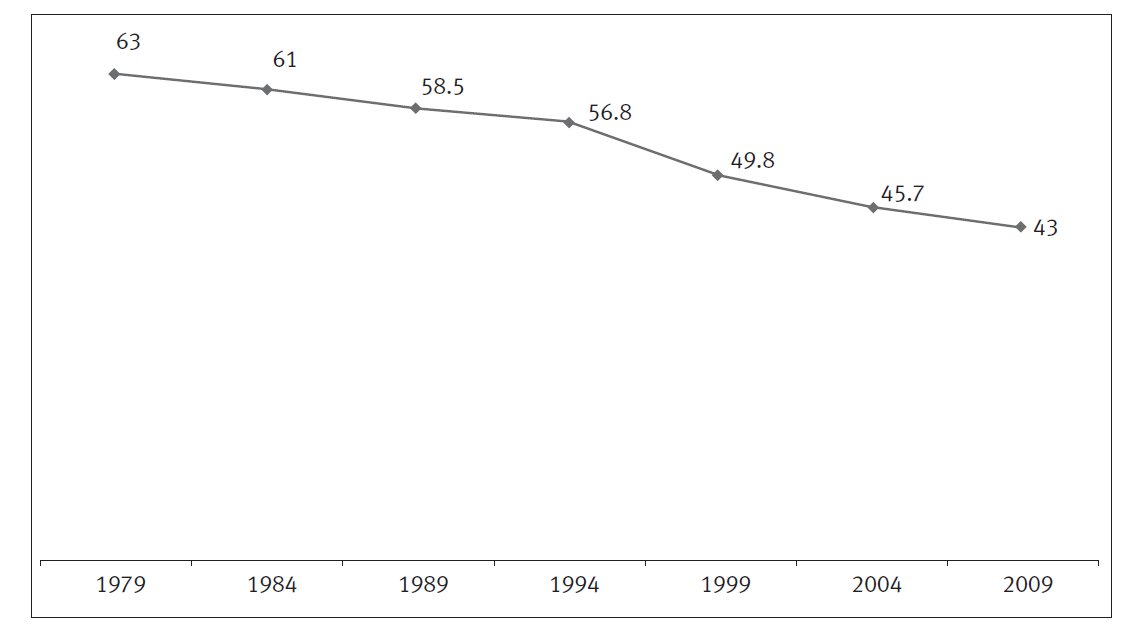
Chart II: Change in the number of voters casting a ballot in European elections (1979-2009)
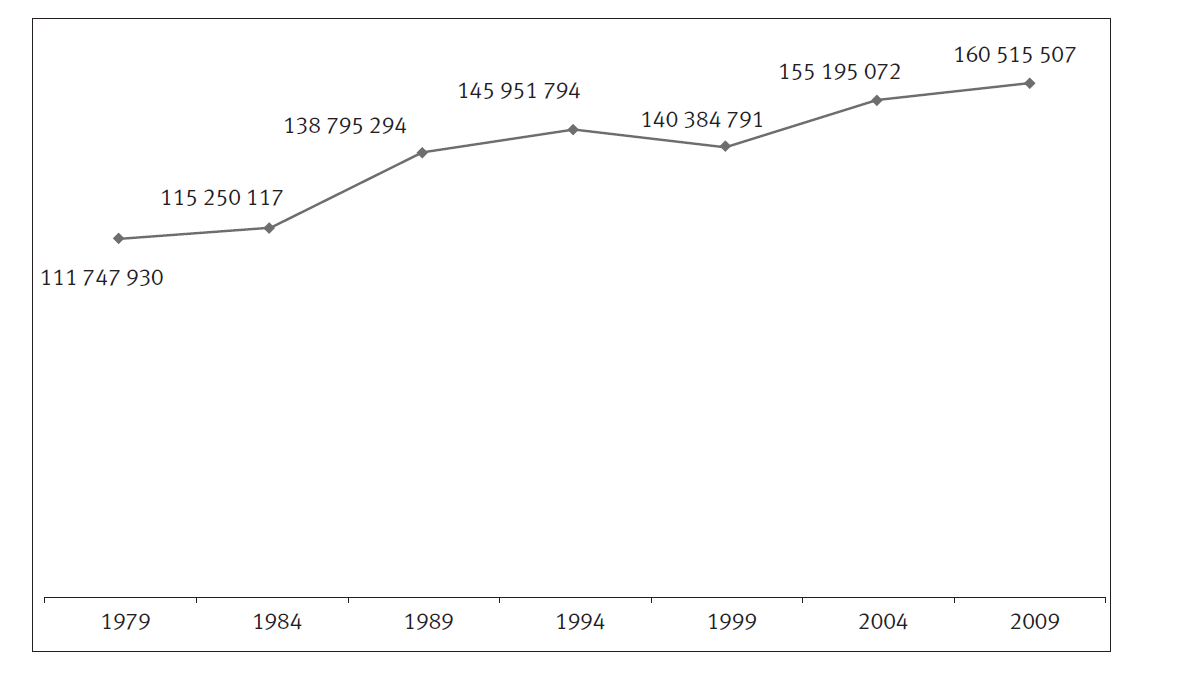
Table I: Results of European elections by party (1979-2009), as a % of votes cast
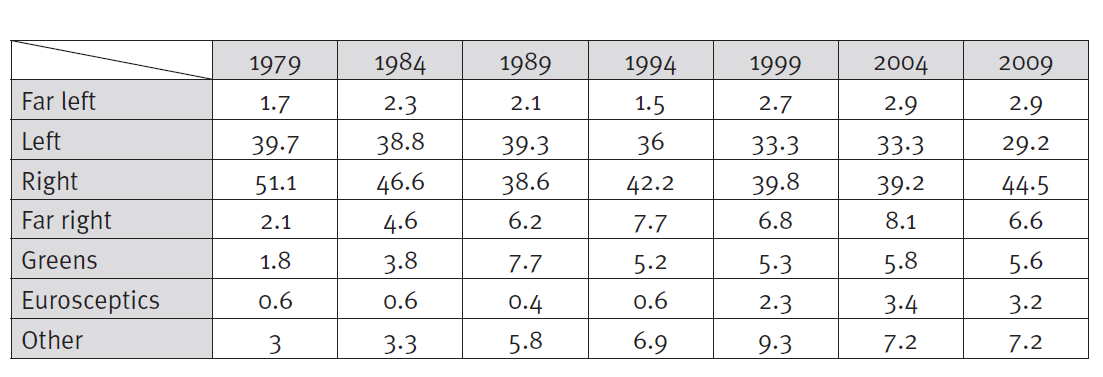
Table II: The five highest scores recorded by centre-right parties in the 2009 European elections

Table III: The five highest scores recorded by centre-left parties in the 2009 European elections

Table IV: Protest votes in the 2009 European elections

Table V: Results of Green parties in European elections (1979-2009), as a % of votes cast

Table VI: Results of far-left parties in European elections (1979-2009), as a % of votes cast

Table VII: Results of far-right parties in European elections (1979-2009), as a % of votes cast

Table VIII: Results of Eurosceptic parties in European elections (1979-2009), as a % of votes cast

Map I: Political hue of national governments prior to the 2009 European elections
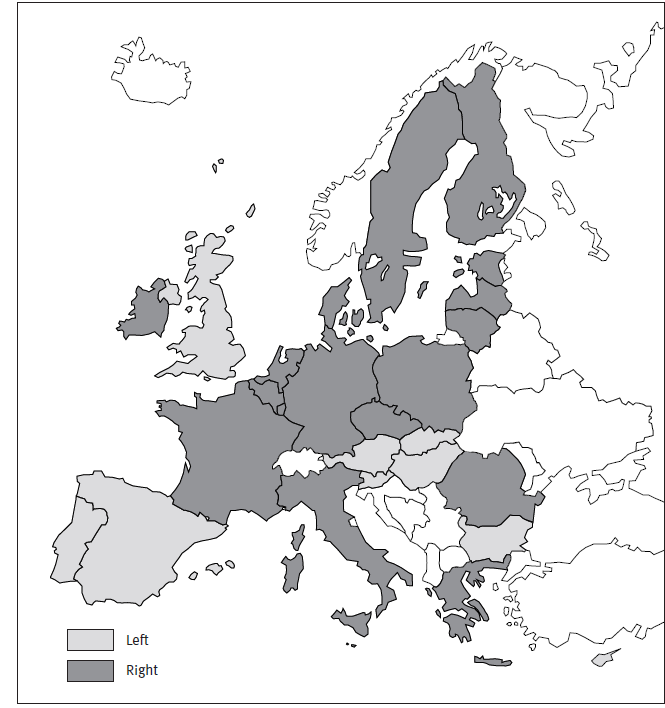
Map II: Political hue of the winners of the 2009 European elections



No comments.