Big tech dominance (1): the new financial tycoons
Introduction
The transformation of American tech champions into global asset managers
Huge reserves of cash sustained by enormous profits
Ultra-conservative cash management
A lasting and undesirable cash hoarding dynamics
Possible solutions to halt the “financialisation” of big tech firms
Speeding up cash distribution through greater shareholder involvement in decision-making ?
Discouraging cash retention through financial regulation?
Limiting future cash accumulation through taxation?
Conclusion
Appendices
Sample composition
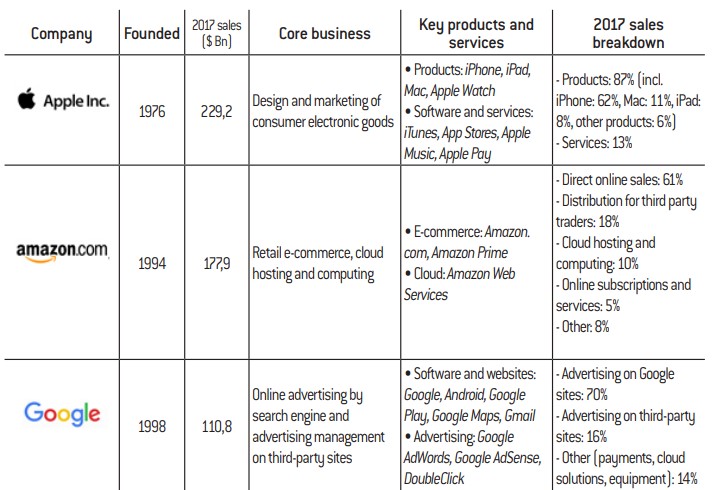
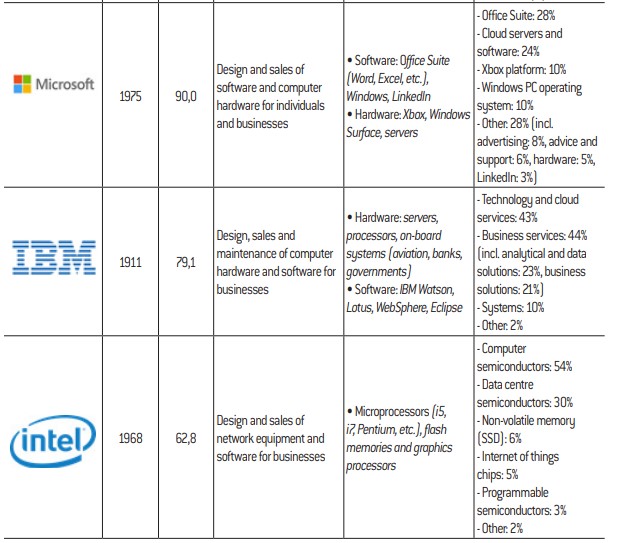
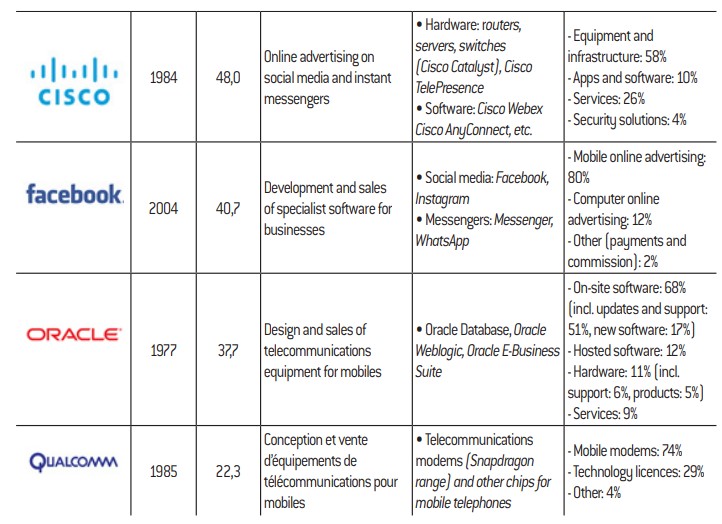
The big tech companies
References

a. Extreme concentration of cash
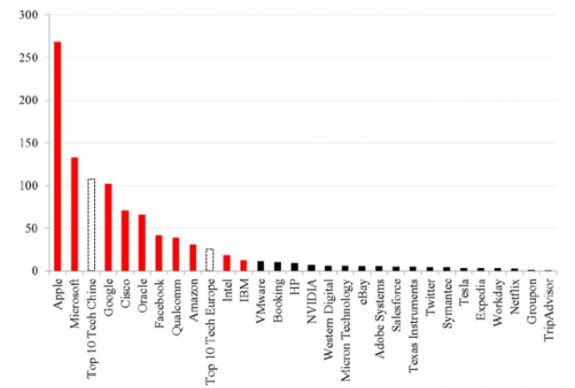
The exponential distribution shown in the graph below highlights an extreme concentration of cash among a small number of tech companies, which are mainly American (shown in red on the graph). In fact, the ten richest of these own seven times more cash than their Chinese counterparts and thirty times more than their European counterparts. Google3 alone possesses almost the same amount of cash as the ten richest Chinese tech giants put together ($102 billion versus $107 billion). Apple holds ten times more cash than the top ten wealthiest European tech companies ($269 billion versus $25 billion.
Graph 1: The world’s leading tech companies’ cash positions at the end of 2017 in billions of dollars (US)
© Fondation pour l’innovation politique, November 2018
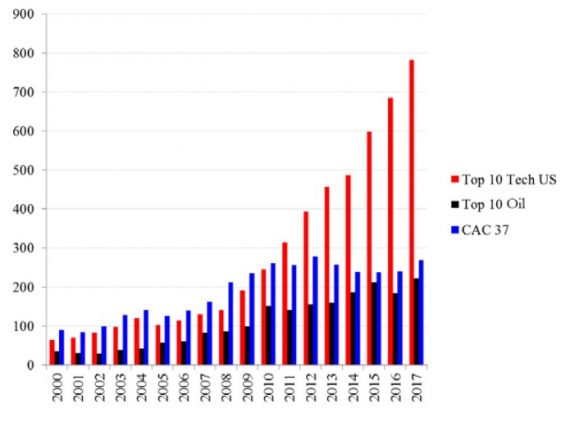
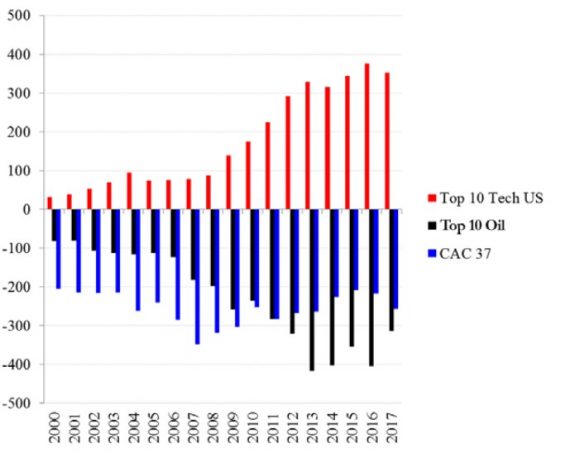
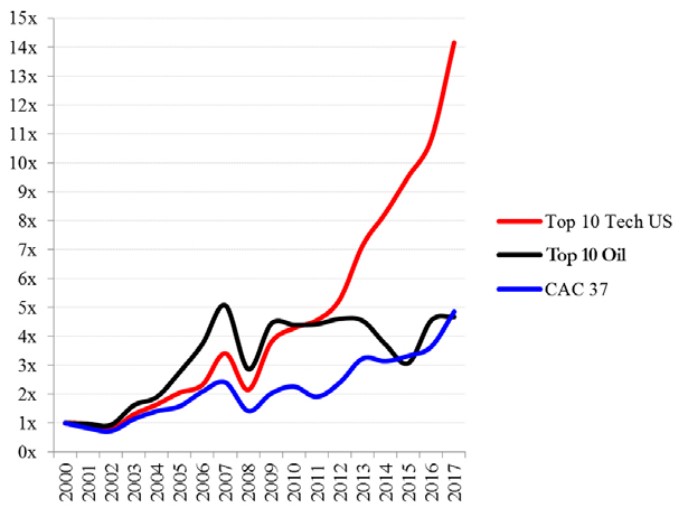
Considering the bigger picture, we decided it would be useful to compare these amounts with those seen in the oil industry, which includes companies that are considered to be particularly powerful and rich, and also with those of the “CAC 37”, which encompasses the main French companies included in the CAC 40 index (excluding its three banking institutions)6.
The results speak for themselves, with “Top 10 Tech US” currently holding 3.5 times more cash and marketable securities than “Top 10 Oil” (compared to 1.8 times at the end of 2000) and approximately 2.9 times more than “CAC 37” (compared to 0.7 times at the end of 2000). The growth of cash and marketable securities among the American tech giants was therefore on a completely different scale to that of the main traditional companies.
Graph 2: Comparison of cash positions in billions of dollars (US)
©Fondation pour l’innovation politique, November 2018
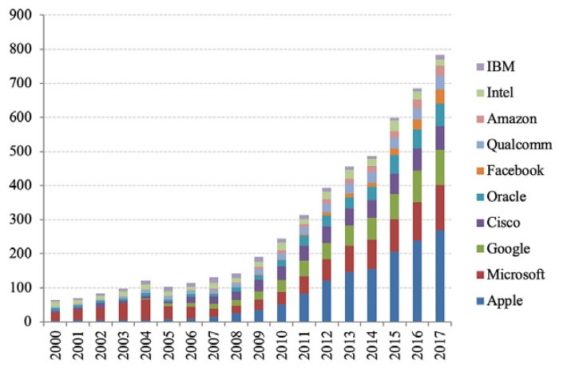
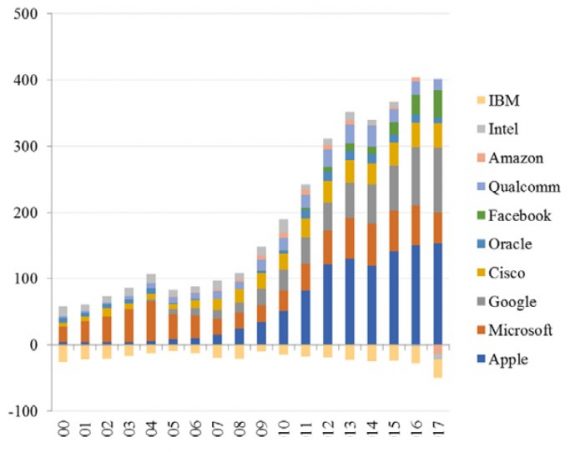
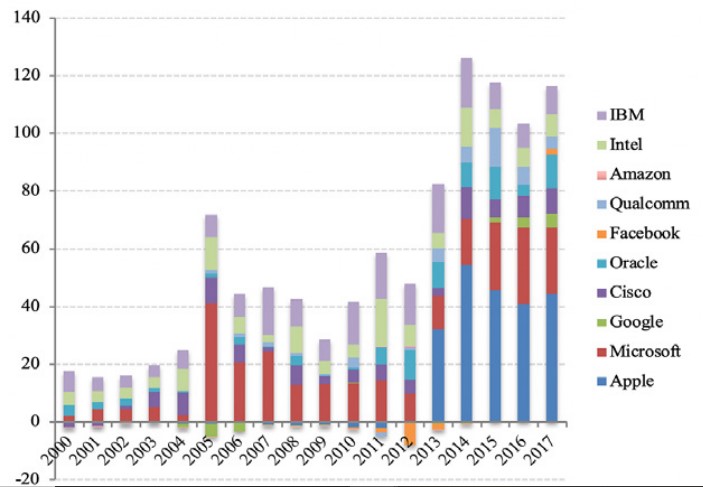
On closer examination of the dynamics of each company in the Top 10 Tech US sample, we note that the top 5 now account for 82% of the total cash and marketable securities (Apple 34%, Microsoft 17%, Google 13%, Cisco 9% and Oracle 8%) and that the rate of cash growth varies among companies. For instance, between 2008 and 2017, Facebook’s cash position grew at the frenetic annual rate of 73%. Apple (31%), Amazon (27%), Google (23%), Oracle (22%) and Microsoft (21%) are above the mean level, while Intel (5%) and IBM (0%) are below it.
Graph 3: Cash positions – Top 10 Tech US in billions of dollars (US)
©Fondation pour l’innovation politique, November 2018
a. Excess cash
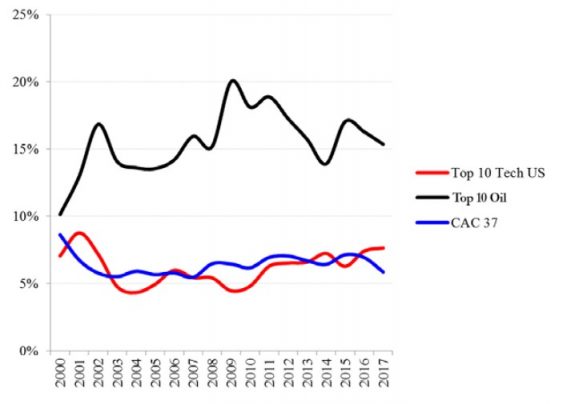
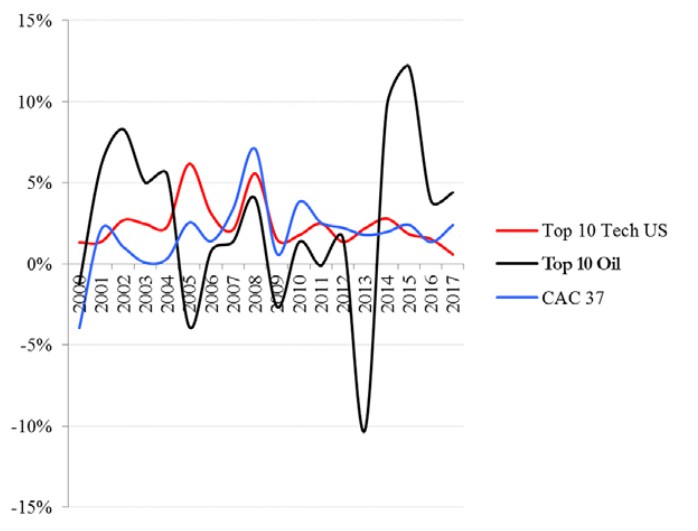
Having noted this meteoric growth in the American tech giants’ cash positions, we will now examine how this cash was accumulated in the first place. To that end, we must go back to the profits that fuel them, measuring them in economic rather than accounting terms in order to discard any non-monetary items included in income statements. Consequently, the relevant variable is free cash flow, or cash from operations less capital expenditures (capex). Compared to the revenues for each period, this indicates a company’s ability to convert its sales into available liquidity for acquisitions of other companies, shareholder remuneration, and finally, allocation to cash positions.
Graph 4: Comparison of free cash flow in percentage of revenues
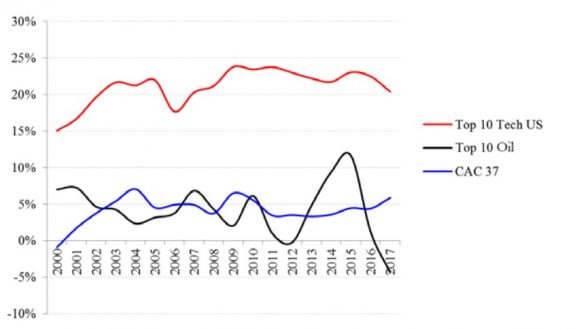
© Fondation pour l’innovation politique, November 2018
A breakdown of the big tech companies’ free cash flow reveals that despite their operations being remarkably profitable, the tech giants have issued debt securities in recent years. We will come back to the reasons for this situation later. In any event, if we calculate total free cash flow for the 2000-2017 period and add back negative flows corresponding to (net) resources, the capital allocation of big tech is as follows: 11% and 46% of “adjusted” free cash flow was used to finance the acquisition of companies (less divested businesses) and shareholder distributions (less capital raised) respectively, while 43% was used to increase the cash positions.
Graph 5: Allocation of free cash flow – Top 10 Tech US in percentage of revenues
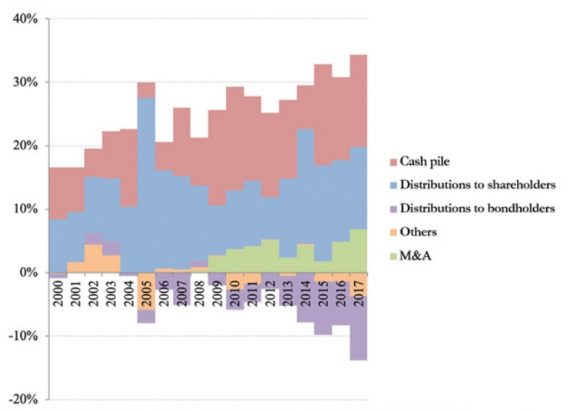
© Fondation pour l’innovation politique, November 2018
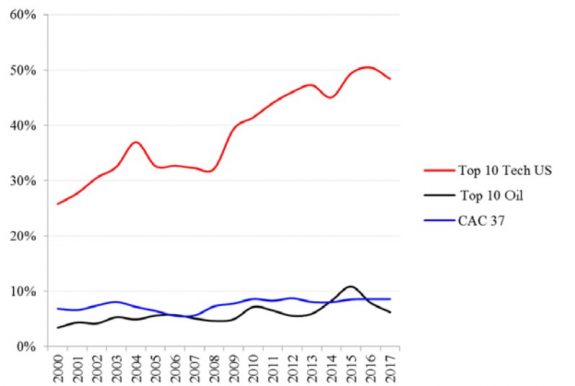
As such, half of the big tech companies’ balance sheet assets now consist of liquid securities available for sale. Drawing on their operational success, the American tech giants have now become de facto financial portfolio managers and seem to edge closer every day to the tacit status of financial institutions.
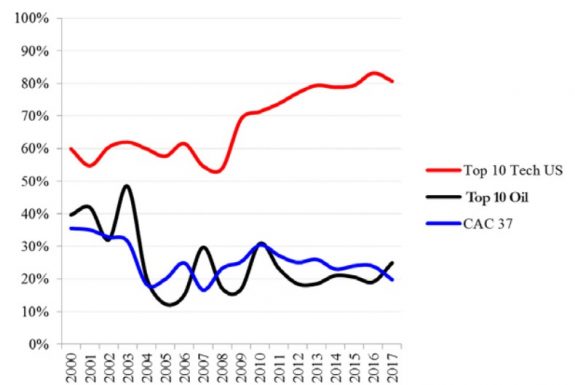
Once again, this average trend masks differences between companies: the balance sheets of Apple (72%), Qualcomm (59%), Cisco (54%), Microsoft (53%) and Google (52%) exhibit the highest degree of “financialisation”, while those of IBM (10%), Intel (15%) and Amazon (24%) are at much more reasonable levels.
Graph 6: Comparison of cash positions as a percentage of total assets
© Fondation pour l’innovation politique, November 2018
b. Increasing maturity of investments
Despite this lack of transparency with regard to management strategies, the companies’ annual reports combined with their regulatory declarations to the Securities Exchange Commission (SEC) provide precious details on the maturity and nature of the assets that make up their cash positions. Firstly, the distinction between “cash and cash equivalents” and “marketable securities” gives an indication on their assets’ maturity. In accordance with the regulatory standards in force, “cash and cash equivalents” are any highly liquid investments with a maturity date that is up to three months from the purchase date, while “marketable securities” are any marketable assets available for sale with a maturity date that is over three months from the purchase date.
Unlike the oil giants and CAC 37 companies, it is apparent that the big tech invest most of their undistributed cash in financial assets with maturity dates of over three months9. Besides, the growth in big tech companies’ cash positions has been accompanied by a gradual increase in the share of relatively longer maturity investments (from 55% of total cash in 2007 to over 80% at the end of 2017).
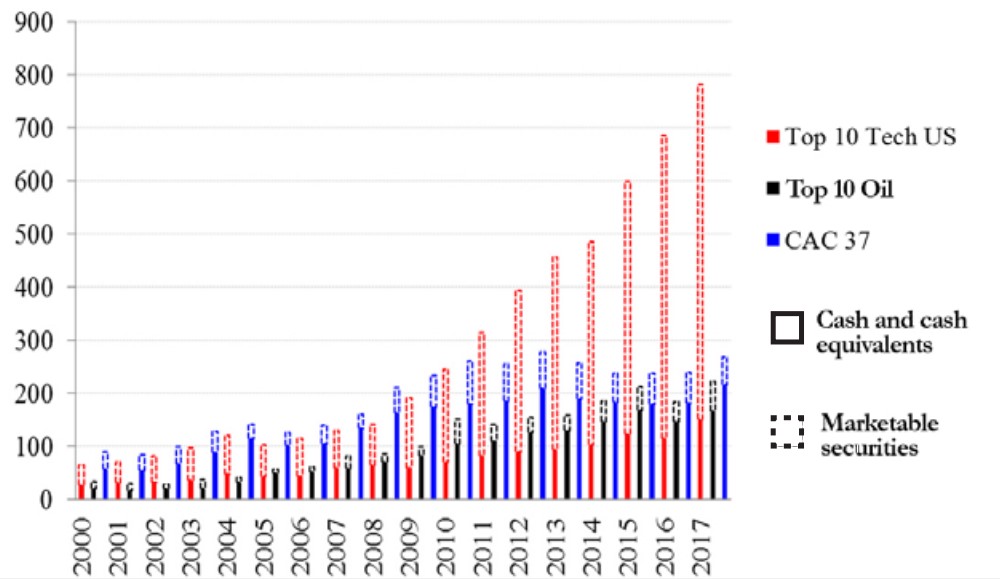
Graph 7: Cash positions: cash versus marketable securities – Top 10 Tech US in billions of dollars (US)
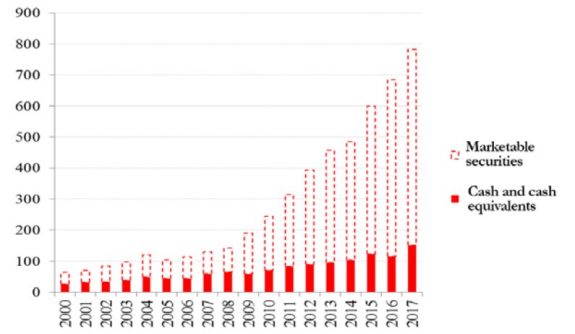
©Fondation pour l’innovation politique, November 2018
Graph 8: Comparison of cash positions – cash versus marketable securities in billions of dollars (US)
Copyright :
© Fondation pour l’innovation politique, November 2018
These idiosyncrasies suggest that the tech giants currently have no intention of using these funds to finance investments or distributions, a sign that their cash positions have reached such high levels that they are no longer used for business operations.
Graph 9: Marketable securities as a percentage of cash positions
©Fondation pour l’innovation politique, November 2018
However, there are interesting differences regarding investment profiles among big tech companies. For example, Apple, Oracle and Qualcomm stand out for allocating over 50% of their cash to corporate bonds, while Microsoft and Facebook use the vast majority of theirs to finance the US government. IBM, on the other hand, is extremely prudent in its allocation, since almost a third of its cash position is made of “pure” cash and two-thirds of safe bank debt. In contrast, Google allocates over 15% of its cash to mortgage-backed securities, while Intel allocates over 20% of its capital to shares in listed companies.
Graph 10: Breakdown of cash positions by asset class – Top 10 Tech US as at the end of 2017
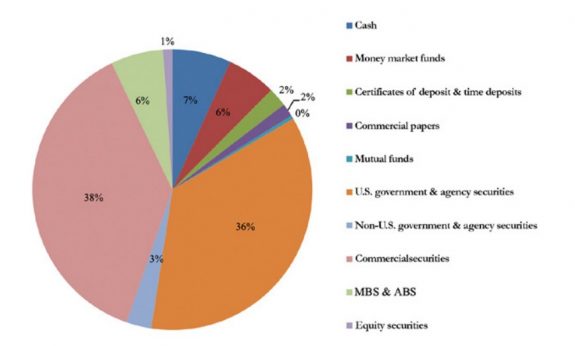
© Fondation pour l’innovation politique, November 2018
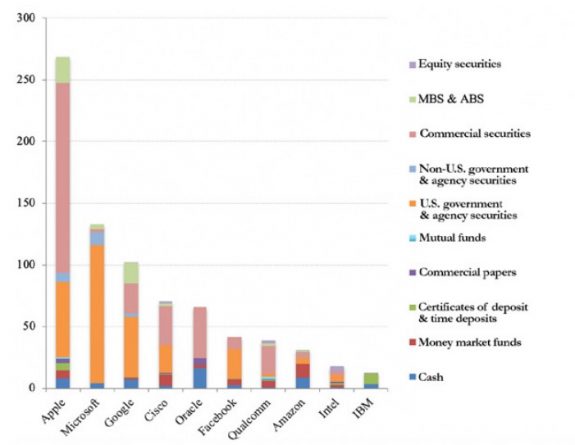
Even though some of these positions entail a relatively higher level of risk, the tech giants’ investment strategy is overall extremely conservative. They all state that their investment decisions are conditional on protecting their initial capital. This strategy clearly implies a strict focus on risk minimisation. For example, all the corporate bonds that they hold are “investment grade”, which means that they have been issued by well-established institutions with the best credit scores.
Graph 11: Breakdown of cash positions by asset class as at the end of 2017 in billions of dollars (US)
© Fondation pour l’innovation politique, November 2018
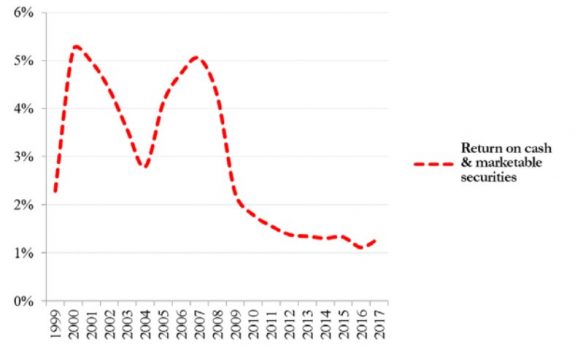
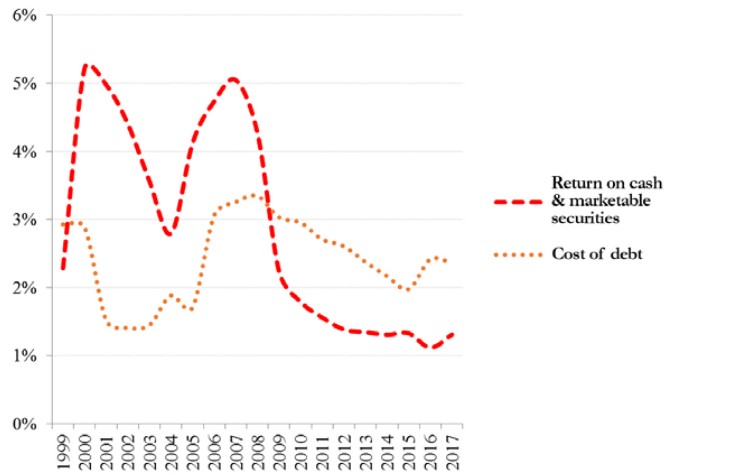
To avoid relying solely on the claims of the companies in question, we determined the average annual return on the big tech companies’ investments by taking into account the interest payments from the cash positions. As the graph below shows, this return is extremely low at approximately 1.3% per annum over the past five years, which is barely equivalent to the consumer price inflation in the United States.
Therefore, while the extraordinary rise in the tech giants’ cash positions seems to be coupled with an extension of the average maturity of the securities portfolio, this has not resulted in greater risk-taking. Far from their image as innovators investing massively in the development of future technologies, the tech giants actually allocate and manage their capital in an exceptionally conservative manner.
Graph 12: Average return on cash and marketable securities – Top 10 Tech US
© Fondation pour l’innovation politique, November 2018
For evidence of this, we need look no further than the trend of the big tech companies’ net cash positions, i.e. cash and marketable securities minus their debts. Although growth of the aggregated “net” position is, as one might expect, less sustained than the “gross” one, it is still very significant: an average of 15% per annum between 2000 and 2017 (versus 16% for the “gross” figure), 13% between 2000 and 2008 (versus 10%) and 17% between 2008 and 2017 (versus 21%). Thus, at the end of 2017, “net” cash and marketable securities reached $352 billion with debt equivalent to just 55% of “gross” cash and marketable securities (versus 242% for the oil giants and 195% for the CAC 37 companies).
Graph 13: Comparison of net cash positions (cash and marketable securities minus total debt) in billions of dollars (US)
©Fondation pour l’innovation politique, November 2018
Finally, we should add that besides having access to other sources of finance such as domestic cash and marketable securities of $141 billion (as at the end of 2017), the tech giants faced no credit restrictions impeding bond issues if they had wished to distribute more cash to their shareholders or finance new investment projects. In other words, even if they had been able to repatriate all their cash domiciled overseas at no cost, it seems highly unlikely that they would have used them differently to the way we have observed.
Hence, the indisputable existence of a tax arbitrage that led big tech companies to issue debts rather than use their cash resources to pay for shareholder distributions only partly explains the hoarding phenomenon.
Graph 14: Net cash positions (cash and marketable securities minus total debt) in billions of dollars (US)
© Fondation pour l’innovation politique, November 2018
The big tech companies’ capital expenditure as a percentage of revenues is currently higher than its long-term trend (8% and 7% in 2017 and 2016 compared to an average of 6% between 2000 and 2017). It is worth noting that at the time of the 2004 “repatriation tax holiday”- a similar situation in which companies had easy access to credit – the impact of repatriation on domestic investment proved negligible. Indeed, according to Wells Fargo (2018), less than 1% of repatriated sums were used to finance capital expenditure18.
Moreover, in addition to the exceptional shareholder value creation generated by the spectacular rise in their share prices, the tech giants did not deviate from the average in terms of distributions. In the long term, their shareholders’ yield is indeed comparable to that of the CAC 37 companies.
Graph 15: Comparison of capital expenditures (as a percentage of revenues )
© Fondation pour l’innovation politique, November 2018
Graph 16: Investment multiple of a diversified portfolio of shares for each sample
Copyright :
© Fondation pour l’innovation politique, November 2018
Graph 17: Comparison of shareholder yield
Copyright :
© Fondation pour l’innovation politique, November 2018
Graph 18: Dividends and net share repurchases in billions of dollars (US)
Copyright :
© Fondation pour l’innovation politique, November 2018
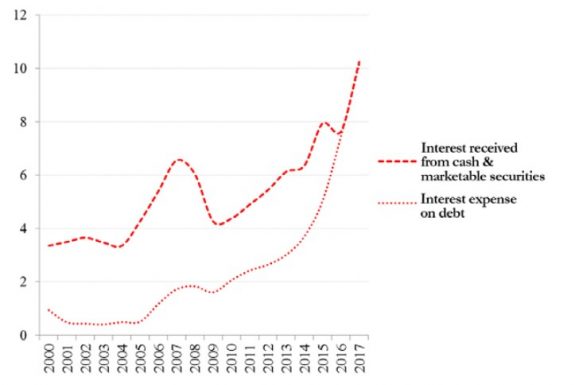
Nevertheless, we think that big tech companies will gradually repatriate a large portion of their cash domiciled overseas in order to repay the face value of their debts when they reach maturity. We believe this is all the more plausible since the interest payable on these debts is currently roughly equal to the total interest generated by cash investments. In any event, it is unlikely that such repatriation will take place overnight for at least two reasons: on the assets side, there is no benefit in the tech giants selling off their bond securities before they mature as this could expose them to losses (especially in a context of rising interest rates); on the liabilities side, even if their debt agreements include early repurchase clauses, it would probably cost more to activate these than waiting until securities mature. This assumption is moreover confirmed by a Bank of America Merrill Lynch survey with a representative sample of relevant companies. When asked “What will you do with your repatriated cash?”, most companies responded that they would “pay down debt”21.
Graph 19: Income from cash positions versus debt service – Top 10 Tech US in billions of dollars (US)
© Fondation pour l’innovation politique, November 2018
Graph 20: Return on cash positions versus cost of borrowing – Top 10 Tech US
Copyright :
© Fondation pour l’innovation politique, November 2018
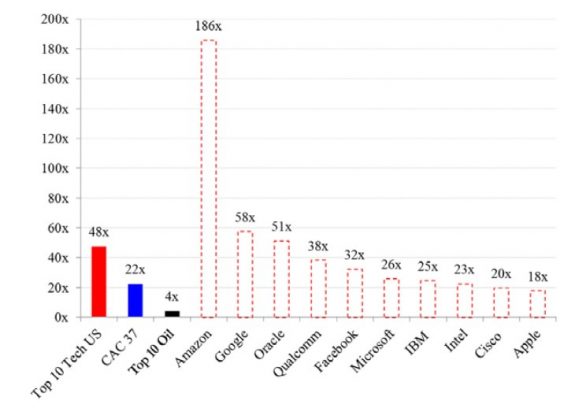
With regard to capital allocation, the question arises of whether the big tech companies’ future cash flows will keep on increasing their cash positions to the same extent as in the past, or whether there will be greater distribution to shareholders. With considerable projected profits reflected by the level of their valuation multiples (see the P/E ratio below), the balance of power between management and shareholders is set to remain largely in favour of the former. So it is highly likely that they will continue to retain a significant portion of future profits for the very same reasons that have hitherto driven them to accumulate such high levels of cash (risk aversion and maintaining financial independence from banks and financial markets).
Graph 21: Comparison of P/E ratios at the end of 2017
© Fondation pour l’innovation politique, November 2018
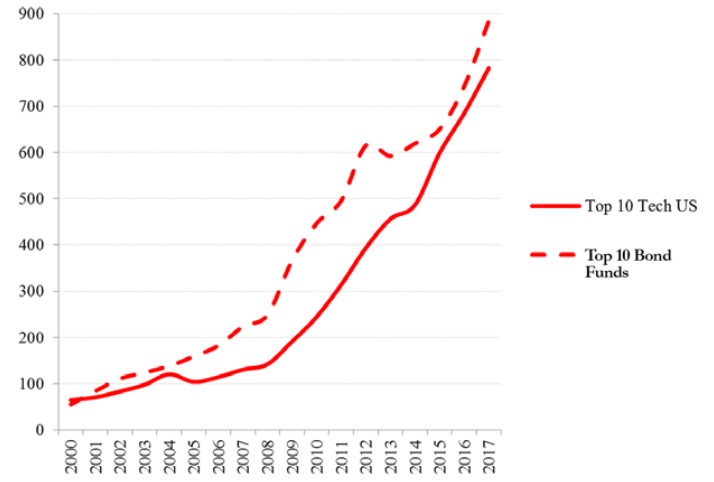
Graph 22: Cash positions of Top 10 Tech US vs. assets under management of top 10 bond funds in billions of dollars (US)
Copyright :
© Fondation pour l’innovation politique, November 2018
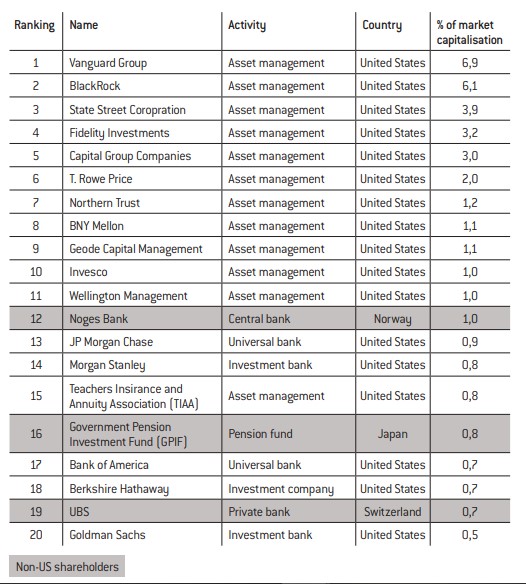
Table 1: Top 20 institutional shareholders of the Top 10 Tech US (aggregated)
Copyright :
© Fondation pour l’innovation politique, November 2018
Copyright :
© Fondation pour l’innovation politique, November 2018


No comments.