Europe in the face of American and Chinese economic nationalisms (2)
Foreign anti-competitive practicesThe multilateral framework of the world trade organization (WTO)
A historically divided Europe on trade defence
Moderate use of anti-dumping and anti-subsidy instruments
The regulatory and institutional specificities of European trade defence
Appendices
Geographical targets for defence instruments, in number of measures in force at the end of 201
Sectoral targets for defence instruments, in number of measures in force at the end of 2018
Geographical and sectoral breakdown of new anti-dumping and anti-subsidy cases opened by the European Commission over the last ten years
The multilateral framework of the world trade organization (WTO)
This agreement is also known GATT (see text of the agreement on https://docs.wto.org/gattdocs/q/UN/ EPCT/214A1R1.PDF).
The first rounds were in Geneva (1947), Annecy (1949), Torquay (1950), Geneva II (1955-1956) and Dillon (1960-1962), allowing more than 60,000 customs reductions covering nearly $20 billion in trade (see chronology on wto.org/english/theWTO_e/minist_e/min96_e/chrono.htm).
Its official name is “Agreement on the Implementation of Article VI of the GATT” (see text on https://docs.wto. org/gattdocs/q/GG/L3799/2812.PDF).
Signed in 1979, a text cancelled and replaced the agreement by the same name of 1967 (text available) For a brief history of anti-dumping agreements, see WTO, “Technical Information on anti-dumping”,
“Agreement on the Interpretation and Application of Articles VI, XVI and XXIII of the General Agreement on Tariffs and Trade”, 12 April 1979
See WTO, cit.
See WTO, “Présentation de l’Accord sur les subventions et les mesures compensatoires (‘Accord SMC’)”, org
The only type of subsidy that falls outside the WTO scope is that of regulatory aid: for example, export bans on raw materials markets, which indirectly subsidise consumers of this raw material. For more details on the definition of a subsidy by the WTO, see “Defining Subsidies”, World Trade Report 2006, pp. 47-54
Not surprisingly, we note here the similarity with the definition of State aid in the European competition WTO rules stipulate that the specificity of a transfer may be de jure or de facto. In addition, any subsidy indexed on the export performance of companies or on the use of domestic rather than foreign inputs is also considered specific.
Three types of adverse effects are considered in WTO agreements:
- “Injury”: imports of subsidised products are injuring the industry of the complainant country because of unfair competition on its domestic market;
- “serious prejudice”: subsidies distort the domestic market of the subsidising country or distort third markets, damaging the complainant country’s The complainant country suffers therefore a prejudice due to unfair competition on its export markets;
- the ” nullification or impairment ” of benefits resulting from WTO accession: subsidies offset the reduction of tariff barriers imposed by WTO This is a circumvention of WTO agreements on customs duties.
Only “prohibited” subsidies and “actionable” subsidies with the adverse effect of “injury” as defined above may give rise to a countervailing In other cases of unauthorised subsidies (subsidies causing “serious injury” or “nullifying or impairing” the benefits of WTO accession), subsidies must be challenged at the WTO but are not countervailable.
Only 36 safeguard measures were in effect in 2018 according to the The countries with the most safeguard measures in place were Vietnam (4 measures in effect), Indonesia (3), Morocco (3), Thailand (3) and Turkey (3).
In the aftermath of World War II, 23 countries committed themselves to the multilateral liberalisation of international trade by signing the General Agreement on Tariffs and Trade in 19471. This agreement marked the beginning of trade negotiation rounds, which have served as a multilateral framework for more than half a century.
The genesis of anti-dumping and anti-subsidies. The first five cycles were mainly dedicated to negotiations on lowering tariffs2. During the sixth, the Kennedy Round (1964-1967), a new subject gained momentum: the fight against dumping, namely the commercial practice of selling goods on foreign markets at lower prices than on domestic markets. While the 1947 agreements already stipulated the prohibition of dumping, decisions on the practical implementation of this prohibition had not been taken, making the rule difficult to enforce. To overcome this, the countries signed an agreement on anti-dumping practices in 19673. This text was subsequently significantly enriched, particularly during the Tokyo Round (1973-1979), when the rules for determining dumping and its damage were clarified4.
The liberalisation of international trade then faced new obstacles: non-tariff barriers and export subsidies. The Tokyo Round led to the signing of agreements on the elimination of non-tariff barriers and the signing of a Subsidies Code in 19795. The latter was subsequently replaced by the Agreement on Subsidies and Countervailing Measures6 during the eighth round of negotiations, the Uruguay Round (1986-1994). This prolific round ended with the creation of the WTO. Since then, the negotiations take place in the context of the Doha Round, which began in 2001. They are hampered by a wide divergence of interests between the 164 WTO members, which we will touch on later. Multilateral rules governing trade defence therefore date mainly back to the mid-1990s.
Three trade defence instruments. Currently, three instruments are available to WTO Member States to protect themselves from so-called “unfair” foreign practices: anti-dumping, anti-subsidy and safeguard measures.
Anti-dumping measures target companies. When a company exports a good at a significantly lower price than it sells on its domestic market, it may be exposed to anti-dumping measures from importing countries. In practice, these measures consist of the introduction of customs barriers – known as anti-dumping duties (AD) – to compensate for this price difference. WTO rules and case law require any country wishing to set up an anti-dumping instrument to prove the existence of three concomitant elements: dumping, injury to its industry and a causal link between dumping and the prejudice in question7. In practice, it may be difficult to prove that a foreign company is dumping given the difficulty of accessing the market price in its country. This is particularly the case for companies based in non-market economy countries. The WTO then provides two options: use the market price in a third party country, or estimate the cost of production and add a profit margin. If a country considers that its companies are unfairly subject to an anti-dumping measure, it may challenge the measure through the WTO’s Dispute Settlement Body. A company itself cannot bring an action before the WTO, it must necessarily be represented by one of the Member States.
Anti-subsidy measures also target companies8, but in order to counter practices carried out by sovereigns. If a government subsidises a particular domestic company or industry to export artificially cheap goods, it is exposed to anti- subsidy measures from countries importing such goods. The WTO has adopted a rather broad definition of subsidies9, including all types of transfers direct and indirect from a government or public entity to the private sector. In order to qualify as a subsidy, a transfer must be specific, i.e. it must target an industry, one or more companies, or a specific geographical area10. The WTO agreements theoretically require the notification of subsidies, even if in practice no coercive mechanism exists. The subsidies are classified into two categories:
- On the one hand, so-called “prohibited” subsidies, which require recipients to meet certain export targets, or to use domestic goods instead of imported goods.;
- On the other, “actionable” subsidies, i.e. all other subsidies. Such measures are allowed, provided that they do not lead to “adverse effects on the interests of another WTO Member11“. A country can put countervailing duties in place in order to counterbalance subsidies from a Non-Member State damaging to its interests. Here again, these measures most often consist of customs barriers in the form of tariffs. As with dumping, WTO rules impose a triple evidentiary regime: the existence of subsidised imports, injury to the industry of the importing country and a causal link between imports and the damage12.
The third type of trade defence instrument is the safeguard action. This measure allows a country to protect itself against a surge in imports that poses a serious threat to its industry. When applied, this involves setting up temporary import quotas or tariff barriers. This type of measure is mainly used by developing countries13.
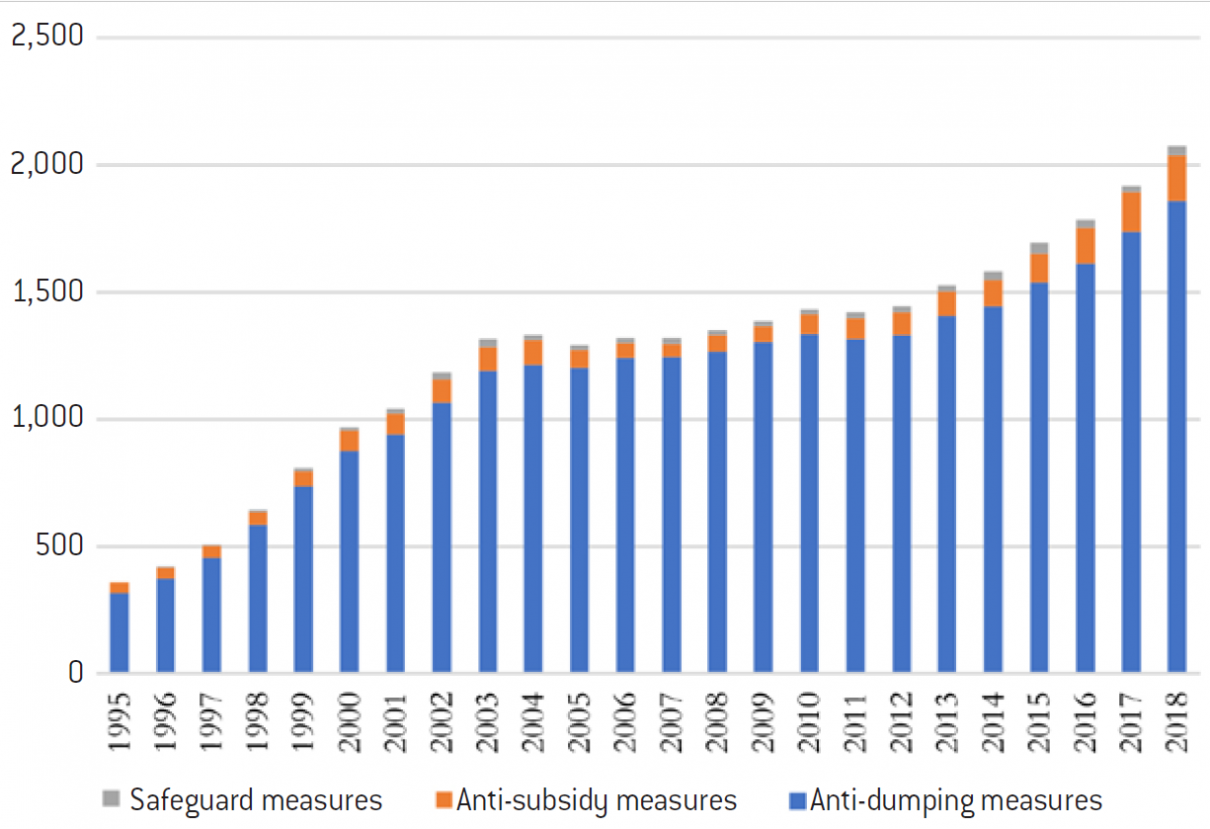
Anti-dumping first and foremost. In fact, the available historical data show that anti-dumping measures constitute the overwhelming majority of the trade defence instruments used. One of the likely reasons for this is that evidence of dumping is significantly easier to establish than evidence of subsidisation. In the first case, it is a question of comparing prices on two markets (the import and export market), while in the second case it is necessary to prove a specific transfer of public funds that has created a situation of unfair competition – which can be quite difficult.
Trade defence instruments in force, all WTO members combined
Source :
WTO
A historically divided Europe on trade defence
Article 3 of the Treaty on the Functioning of the European Union (TFEU).
Article 207 TFEU details the sharing of responsibilities for the common commercial policy between the various institutions
See Simon J. Evenett and Edwin Vermulst, “The Politicisation of EC Anti-dumping Policy: Member States, Their Votes, and the European Commission”, The World Economy, vol. 28, n°5, p. 701-717, May 2005. And Håkan Nordström, “The Political Economy of EU Anti-dumping Policy: Decoding Member States Votes”, wto.org, July 2011
In Europe, trade policy is an exclusive competence of the European Union14. Brussels is therefore responsible for negotiating trade agreements, developing the customs policy, representing European interests at the WTO and implementing trade defence. The European Commission’s Directorate-General for Trade carries out the majority of these responsibilities, under the close supervision of the European Parliament and the Council15.
Two historical blocks: the North vs. the South. Europe has historically presented a disunited front in the fight against unfair foreign competition, with a clear dividing line between two blocks of Member States. On the one hand, the “Northern” countries, particularly the Scandinavian countries (Denmark, Finland, Sweden), Germany, the Netherlands, Luxembourg and the United Kingdom, generally oppose the fight against dumping or foreign subsidies, because they consider trade defence instrument as a form of protectionism. With a political tradition of free trade, they emphasise the risk of the regulator being captured by rent-seeking industrialists concerned to protect their market shares from international competition. On the other hand, the “Southern” countries, namely France, Italy, Spain, Portugal and Greece seems more inclined to protect their industries through trade defence instruments. Academic work16 has also made it possible to identify a third group of “non-aligned” countries, sometimes leaning towards one block and sometimes towards the other on a case-by-case basis. These countries typically include Belgium, Austria and Ireland.
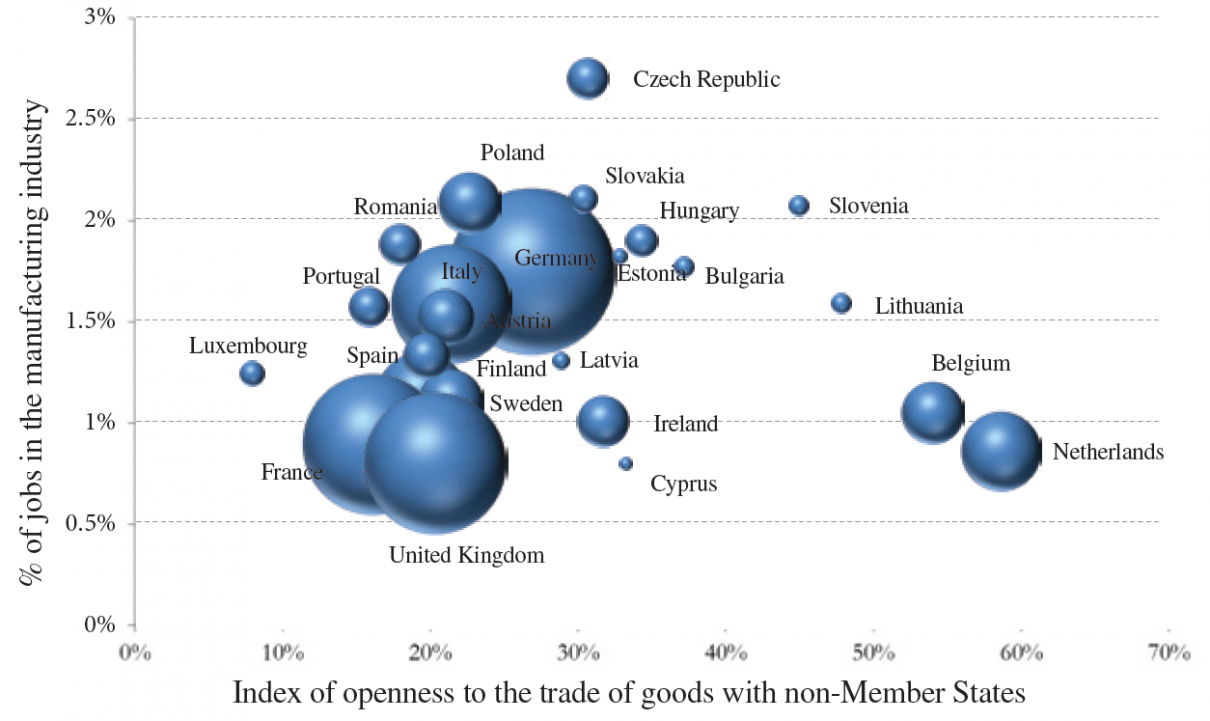
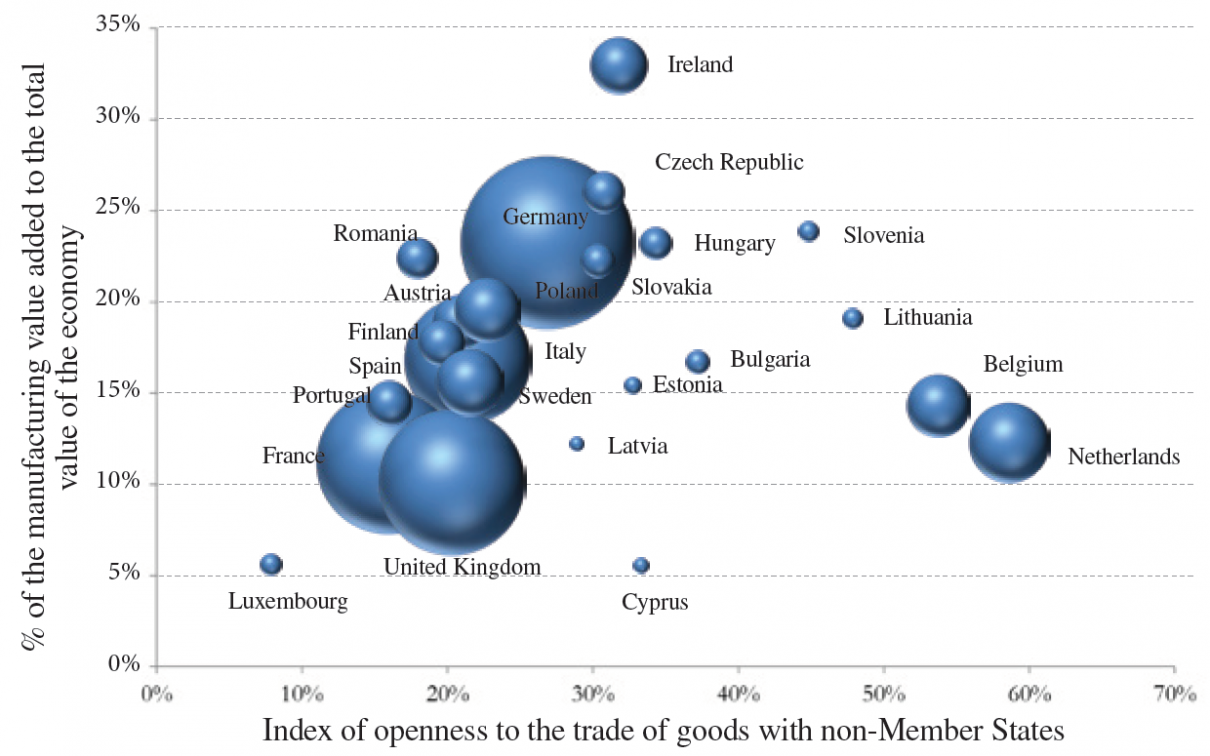
The causes of this split. How can these deep and persistent divisions between countries be explained? First of all, the specificities of the economies of Member States could be part of the answer. In order to examine the relevance of this hypothesis, we consider two explanatory variables. The first concerns the relative weight of the manufacturing sector in the economy of each Member State, in terms of the number of jobs it provides and its contribution to the total value added. A priori, it is reasonable to believe that the greater the weight of a country’s manufacturing sector, the more this country should be committed to safeguarding the interests of this sector and therefore encourage the adoption of a strong trade policy stance against unfair foreign practices.
The second variable we consider aims to characterise the degree of openness of the economy to trading with non-Member States: it is computed as the ratio of total trade in goods (absolute value of exports and imports) to GDP. In principle, the more open the country is to trade with the rest of the world, the greater its reluctance to use trade defence instruments should be, as it would have a lot to lose in the event of tariff retaliation. The graphs on the following page show the situation of each Member State of the European Union according to these two variables (relative weight of the manufacturing industry on the y-axis, degree of openness to trading in goods with non- Member States on the x-axis).
Positioning of Member States according to the size of their industry in terms of employment and their openness to trading goods with non-Member States (end of 2018)
Source :
Fondation pour l’innovation politique; data from the European Commission (Ameco database).
Positioning of Member States according to the size of their industry in terms of contribution to total value added and their openness to trading goods with non-Member States (end of 2018)
Source :
Fondation pour l’innovation politique; data from the European Commission (Ameco database).
See Nicolas Rigaudière, “In the democratic world, globalization is an opportunity”, in Dominique Reynié (dir.), Democracies Under Pressure, Fondation pour l’innovation politique, vol. I, “The Issues”, pp. 50-51, 2019
Regardless of the criterion used to characterise the relative weight of the manufacturing sector in the economy, it appears that these two variables only very imperfectly explain the political positions of the various European countries with regard to trade defence. Indeed, interventionist countries should, in theory, appear in the upper left part of the graph, whereas supporters of free trade should be in the lower right part. Only the Netherlands is in fact in its expected position. Several cases give rise to questions. For example, France’s interventionist stance contrasts with the low weight of the manufacturing sector in its economy. Belgium’s wait-and-see attitude is surprising, given its very high degree of trade openness and the relatively modest weight of its manufacturing sector. Finally, Germany’s “laissez-faire” attitude is perplexing, when one acknowledges the importance of its industry relative to its degree of trade openness with non-Member States.
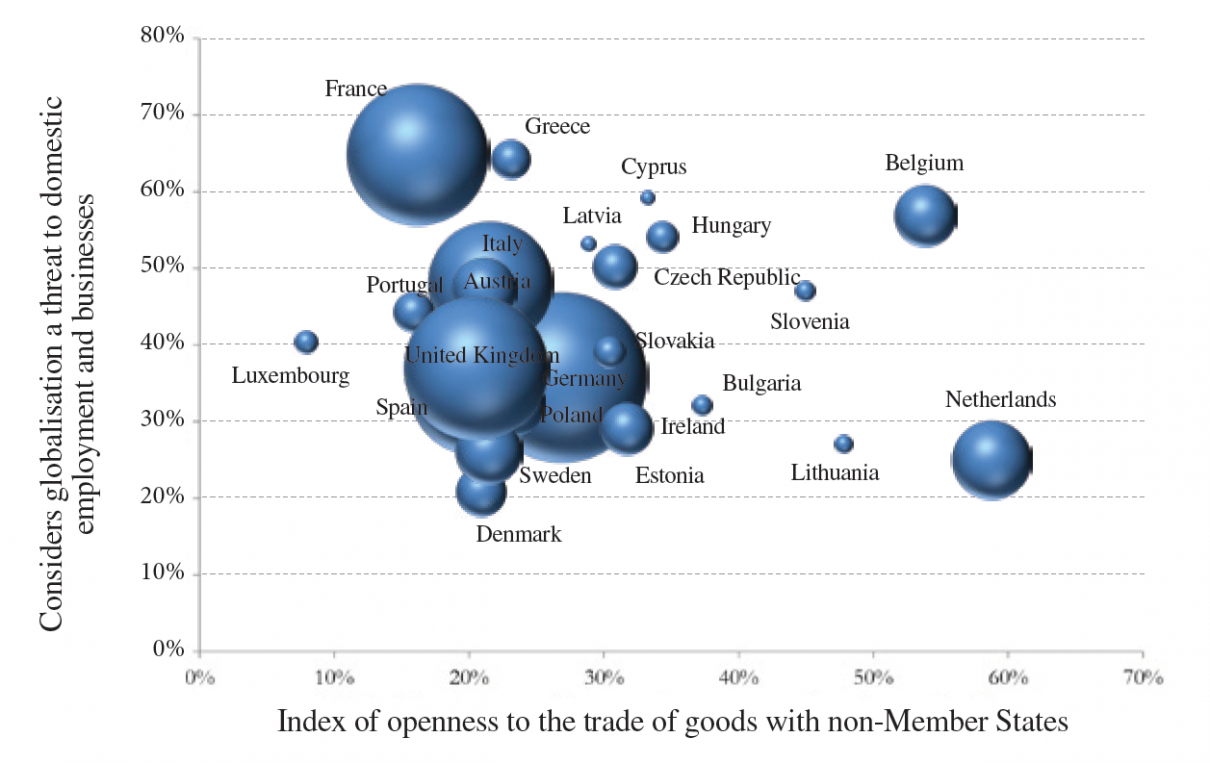
This observation therefore calls for further reflection by integrating the weight of collective representations, in particular perceptions of the economic impact of trade globalisation. As illustrated in the graph below, which is based on data from the latest available Eurobarometer, perceptions of globalisation vary significantly within the European Union itself. Data from the global study Democracies Under Pressure, carried out in 42 countries by the Fondation pour l’innovation politique and the International Republican Institute, confirm these differences across Member States17.
Member States’ positioning in terms of perceptions of globalisation and their openness to trading goods with non-Member States (end of 2018)
Source :
Fondation pour l’innovation politique; data from the European Commission (Ameco, Eurobarometer).
Emmanuel Combe, Paul-Adrien Hyppolite and Antoine Michon, Europe in the face of American and Chinese economic nationalisms (3). Defending the European economy through trade policy, Fondation pour l’innovation politique, March 2020
Two categories of countries can be distinguished: firstly, those whose index of openness to world trade of goods seems to be in line with representations of globalisation, following the example of France and the Netherlands; secondly, those for which the divergence is obvious, with a very clear hiatus between preferences for trade openness and the reality of this openness. Thus, despite the ideological attachment of the Swedes and Danes to free trade and their confidence in the benefits of globalisation, their economies remain relatively close to trade with the rest of the world (outside the European Union). Conversely, Belgium has a high rate of trade openness while the Belgian population is deeply concerned about the consequences of globalisation.
In any case, integrating these collective representations of globalisation makes it possible to better understand the political position of each Member State. In the lower and upper part of the graph, we find the two blocks: the “North” (Denmark, Sweden, Netherlands, United Kingdom, and Germany) vs. the “South” (France, Italy, Portugal, and Greece). The literature cited above confirms that Member States’ positions in the Council are mainly influenced by opinions on free trade.
A recent repositioning in favour of trade defence. Nevertheless, several recent signals and events point to a re-composition of this dated line of division. First of all, the consequences of insufficient European firmness in the 2013 photovoltaics’ case – on which we go into detail in the third study of this series18 – were an opportunity to raise awareness of trade defence issues in Germany, where local industry has been very severely affected by dumping by Chinese exporters. Then, in 2016, three major events followed one another:
- in March, the publication of the European Commission’s communication on steel describing China’s aggressive trade policy and warning against the disastrous consequences of prolonged inaction for an industry representing 1.3% of the European Union’s GDP and 328,000 direct jobs;
- in June, the vote in favour of Brexit, which would eventually mean the departure of one of the main members of the bloc traditionally opposed to the establishment of trade defence measures;
- in November, Donald Trump’s victory in the S. presidential election, driven by its protectionist “America First” agenda and elected thanks to the vote of the “losers” of globalisation.
In the same year, the Slovak Presidency of the European Union put the European Commission’s 2013 proposal for the reform of trade defence instruments back on the agenda. The strong trade tensions during the year of 2018 between the United States and the European Union only reinforced this collective awareness of the need to align behind a “powerful Europe”, the only one capable of defending our common interests. Previously, France had long tried – with little success – to convince Germany to take a stronger stance in cracking down on foreign anti-competitive practices. Beyond the events mentioned above, the increasing sensitivity of the German authorities to threats that are shaping the future of the automotive sector has likely contributed to precipitating a shift in their position on trade defence.
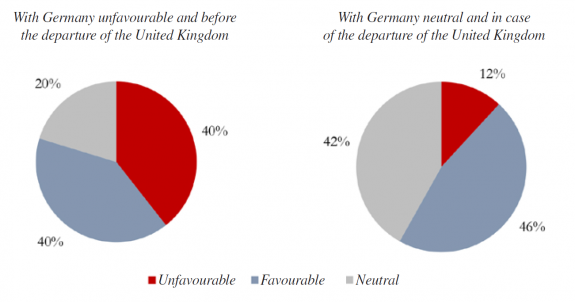
In any case, it is clear that Germany’s repositioning and the United Kingdom’s exit from the European Union should substantially shift the European barycentre to more interventionist countries, such as France. These changes also make potential amendments to the European trade defence policy more credible from a political standpoint.
The positions used in the baseline scenario are as follows:
- favourable: Belgium, Spain, France, Greece, Italy, Portugal;
- neutral: Bulgaria, Croatia, Cyprus, Czech Republic, Estonia, Hungary, Latvia, Lithuania, Malta, Poland, Hungary, Romania, Slovakia, Slovenia;
- unfavourable: Germany, Austria, Denmark, Finland, Ireland, Luxembourg, Netherlands, United Kingdom,
Note: The graphs were obtained on the basis of the populations of the Member States in 2018, by using the positions traditionally adopted by the Member States at the Council on trade defence issues. The positions used are those presented in the above-mentioned research projects. As data are only available for the fifteen members of the European Union of 1995 (EU15), we have assigned a “neutral” position by default to the other thirteen current members19.
Distribution of traditional positions on trade defence at the Council in proportion to the population of each Member State
Moderate use of anti-dumping and anti-subsidy instruments
See Laura D’Andrea Tyson, Who’s Bashing Whom? Trade Conflict in High Technology Industries, Peterson Institute for International Economics, 1992.
It should be noted that the main tariffs introduced by President Trump are not trade defence instruments within the realm of the They are therefore not included in the data.
2,030 billion euros of imports in the United States 1,706 billion euros of imports in Europe respectively in 2016 (source: Eurostat).
Having studied the main political balances underlying trade defence in Europe, let us now turn to the use of anti-dumping and anti-subsidy instruments. We will start by comparing aggregate statistics between the European Union and the United States, before going into detail on European data based on an examination of all anti-dumping and anti-subsidy cases opened by the European Commission over the last ten years.
Comparison between Europe and the United States over a long time period. Historically, the use of anti-dumping measures became increasingly common among American and European companies in the 1980s, in the context of the rise of their Asian competitors20. In addition, the use of the anti-subsidy instrument has long been marginal compared to anti-dumping, but this is evolving as we will see.
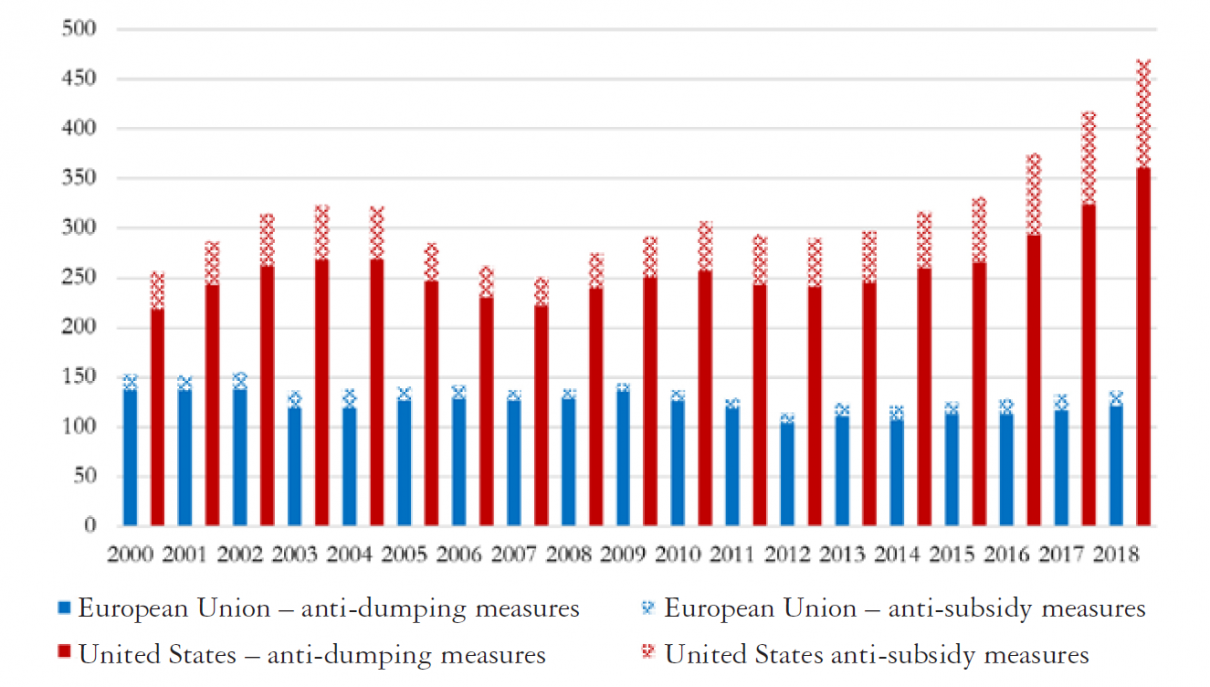
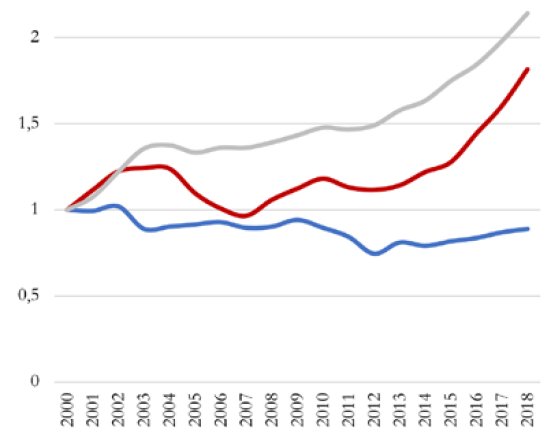
Focusing on the last two decades, WTO data show that the United States invariably stands out compared to the European Union by a significantly higher use of trade defence instruments. Contrary to what one might think, the U.S. administration’s strongest stance in cracking down on unfair foreign practices does not date back to the election of Donald Trump21. Even before the commencement of his term, the number of trade defence measures in force in the United States was almost three times higher than in Europe (375 measures compared to 128 in 2016), for a volume of imports of goods from the rest of the world that was barely much higher22.
Trade defence instruments: number of measures in force in the United States vs. the European Union
Copyright :
Note: The WTO data used in this graph count the number of trade defence instruments in effect by taking into account the number of countries targeted by each instrument (an instrument on a given type of good targeting three separate countries simultaneously is therefore counted three times).
Source :
Fondation pour l’innovation politique; WTO data.
Moreover, we observe that the trend since the early 2000s indicates a slight decrease in the number of anti-dumping and anti-subsidy measures in force in the European Union (-11%), in parallel with a very significant increase in the United States (+82%), which materialises in particular from 2013, i.e. the start date of President Barack Obama’s second term in office (see annex).
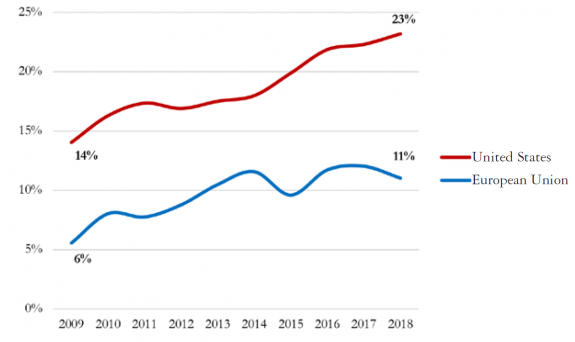
Undeniably, the United States seems increasingly ready to protect their domestic industries through corrective customs duties. To this end, we note an increasing use by the American administration – and more systematically than in Europe – of anti-subsidy instruments. In ten years, the proportion of anti-subsidy cases has increased from 14% to 23% in the United States. This development is also visible in Europe, although it seems to have slowed down over the last five years.
Share of anti-subsidy measures in the overall measures in effect (with the exception of safeguard measures)
Source: Fondation pour l’innovation politique; WTO data.
China accounts for 49% of European sanctions, compared to only 37% in the United India is the country second-most concerned, with 9% of U.S. sanctions and 7% of European sanctions.
The chemical sector is in second place with 19% of cases in the United States and 29% in the European sanctions.
European Parliament, “Balanced and Fairer World Trade Defence. EU, US and WTO Perspectives”, paper commissioned by the European Parliament’s Committee on International Trade at a seminar organised by the Union’s Directorate-General for External Policies, June 2019
Study cited in ibid.
It should be noted that the data discussed here are flow data (new open surveys) and not stock data (cases in effect) as in the previous paragraph.
The opening of an anti-dumping or anti-subsidy investigation by the European Commission systematically requires the publication of a “notice of initiation” in the Official Journal of the European Union.
These are anti-dumping duties for the anti-dumping proceeding and countervailing duties for the anti- subsidy proceeding
Indeed, the European Commission has systematically decided to close the investigation following the withdrawal of the complaint in the cases in question, whereas it would have been required to pursue it if the existence of injury had been proven.
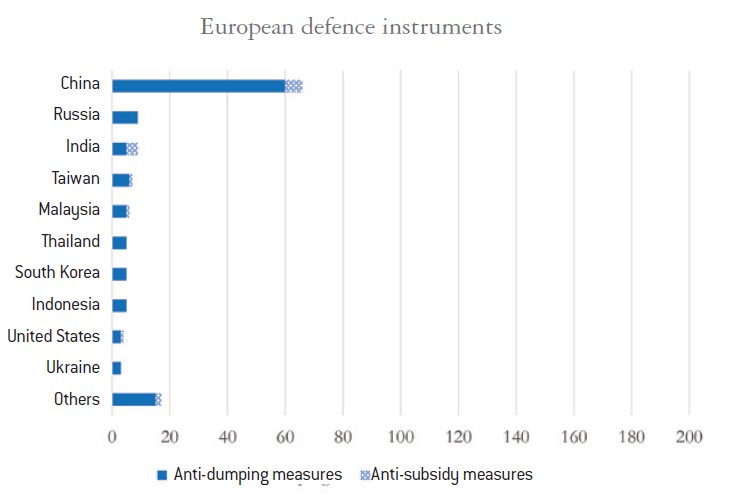
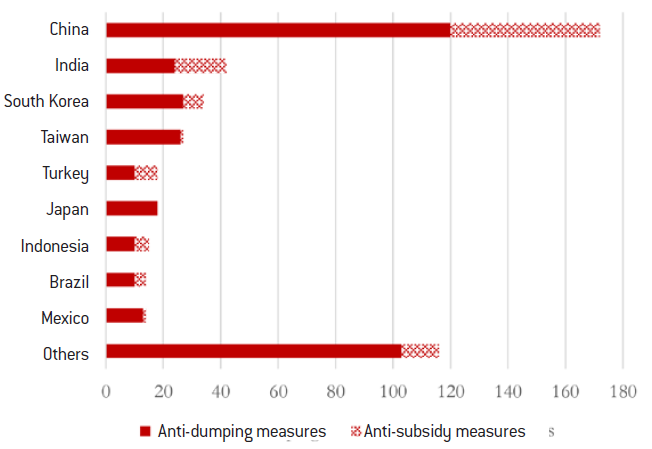
In addition, an examination of the geographical origin of exports and the sectors covered by trade defence instruments on both sides of the Atlantic shows that US sanctions are less geographically concentrated23. However, they are more so at the sectoral level, with 50% of cases in the steel sector compared to 40% in the European Union24 (for more details, see in appendices the geographical and sectoral breakdowns).
At this stage, it is important to interpret the results of this analysis with preliminary caution. Indeed, so far we have only been able to compare two imperfect aggregates, namely the number of cases in force and the total value of imports. In reality, it should be possible to compare effective rates, taking into account not only nominal tariff rates but also the underlying trade volumes. Thus, a detailed analysis of the situation would require a review of the conclusions of each investigation and the isolation of rates and value on a case-by-case basis of the imports concerned. To our knowledge, this exercise has never has been carried out in a comprehensive manner. In any case, it largely exceeds the limits of this study.
Nevertheless, two academic studies published in 2019 allow us to move in this direction. Focusing on Chinese exports, a first study estimates that 6% of them were subject to anti-dumping duties in the United States in 2014, compared to 3.5% in the European Union25. In addition, another study analyses the relative impact of U.S. and European anti-dumping legislation on the basis of two criteria: the total reduction (effectiveness criterion) and marginal reduction (efficiency criterion) of dumped imports of Chinese goods following the imposition of anti-dumping duties26. It finds that the introduction of defence instruments have led to an average drop of 66% in Chinese exports of the products concerned to the United States over the period 2000-2014, compared with 48% for the European Union. On the other hand, the reduction in imports per unit of anti-dumping duties introduced was greater in the EU. They conclude that the EU legislation, although less effective than the U.S. legislation in reducing the volumes of imports benefiting from unfair conditions of competition in the WTO sense, appears to be relatively more efficient. Although this study has its limitations, since it only considers Chinese exports and is based on a limited number of products, it has the merit of providing figures which confirm that the European Union shows less trade defence activism than the United States.
Analysis of recent European trends. In order to deepen the history of the trade defence instruments set up by the European Union, we have built a database containing detailed information on each of the anti-dumping or anti-subsidy cases initiated by the Commission over the last ten years (2009-2018)27. To this end, we have used the various publications in the Official Journal of the European Union that underline the life of an investigation, from the “notice of initiation” to the final “implementing regulation”28.
Without predicting their conclusions at this stage, the European Union’s latest anti-dumping and anti-subsidy investigations focused mainly on two capital-intensive sectors (steel and chemicals, with 37% and 31% of new investigations respectively) and targeted mainly imports from China and India (see detailed data in appendices). In addition, the rise of the anti-subsidy instrument mentioned above is confirmed, both in absolute numbers of cases and number of products covered by customs duties (see appendices). We notice, however, that the majority (69%) of these anti-subsidy proceedings are subject to a parallel anti-dumping proceeding. Two explanations can be given. On the one hand, anti-subsidy investigations are generally more demanding. It is in fact very rare to see an investigation involving several countries at the same time, whereas this is common in anti-dumping matters. On the other hand, the authorities may have an interest in conducting an anti-dumping procedure in parallel with the anti-subsidy one, in order to introduce additional customs duties if they subsequently find that the countervailing duties in the anti- subsidy proceeding do not fully cover the price differential established by the anti-dumping methodology.
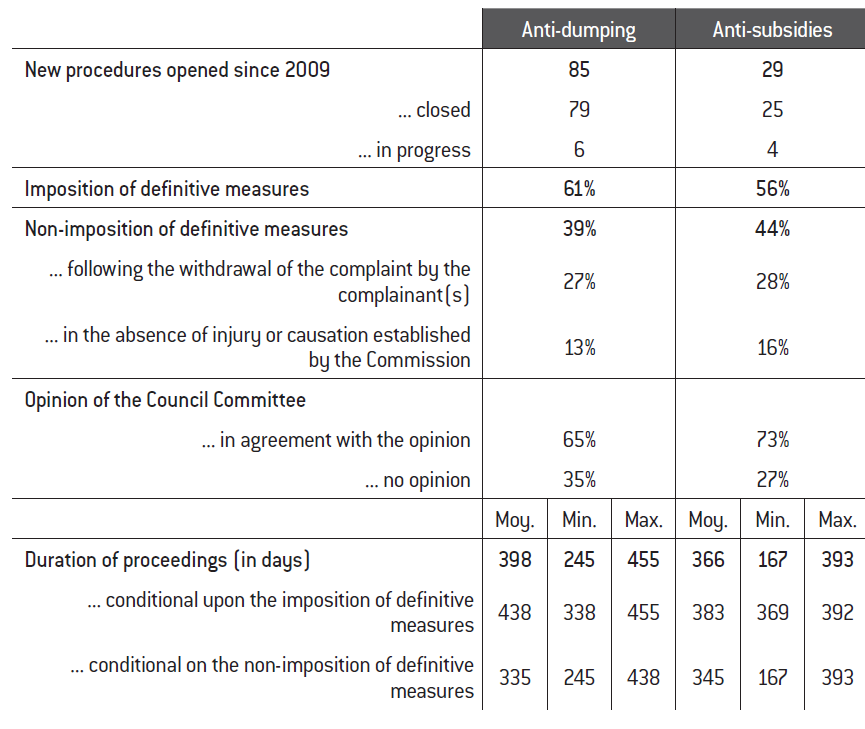
The following table provides an overview and summary of the duration of the above-mentioned investigations. The percentage of anti-dumping and anti-subsidy proceedings leading to the imposition of definitive measures29 is similar, around 60%. In these cases, anti-subsidy proceedings generally tend to be shorter than anti-dumping ones. In cases not involving the imposition of definitive customs duties, it can be seen that 60% to 70% of investigations are closed before the publication of the European Commission’s conclusions because of the withdrawal of the complaint by the European firm(s) concerned. The reason for these withdrawals is unfortunately never known, although it is reasonable to assume that manufacturers do so when they anticipate an unfavourable outcome of the proceedings30.
Review of the anti-dumping and anti-subsidy proceedings initiated by the European Commission from January 2009 to the end of November 2019
Source :
Fondation pour l’innovation politique; data from the Official Journal of the European Union
Since some companies appear in several cases, we have taken this into account by assigning them to the corresponding coefficient
A very uneven geographical distribution of the complaining companies. At this stage, we wanted to know more about companies using trade defence instruments. In particular, what are they and where are they located on European territory? With this in mind, we have identified all companies named as complainants in the new anti-dumping and anti-subsidy cases over the last ten years. Using Google Maps, we then geo-located the headquarters of each of these companies (making sure it was a good proxy for the location of the main production site), and plotted this data with Mapbox’s mapping software on a heat map31. This clearly shows a very uneven distribution of complainants across Europe’s territory with a high concentration in a few regions such as North Rhine-Westphalia and Saarland in Germany, Flanders in Belgium, Veneto in Italy and the province of Madrid in Spain.
Location of the head offices of the complaining companies named in the anti-dumping and anti-subsidy investigations
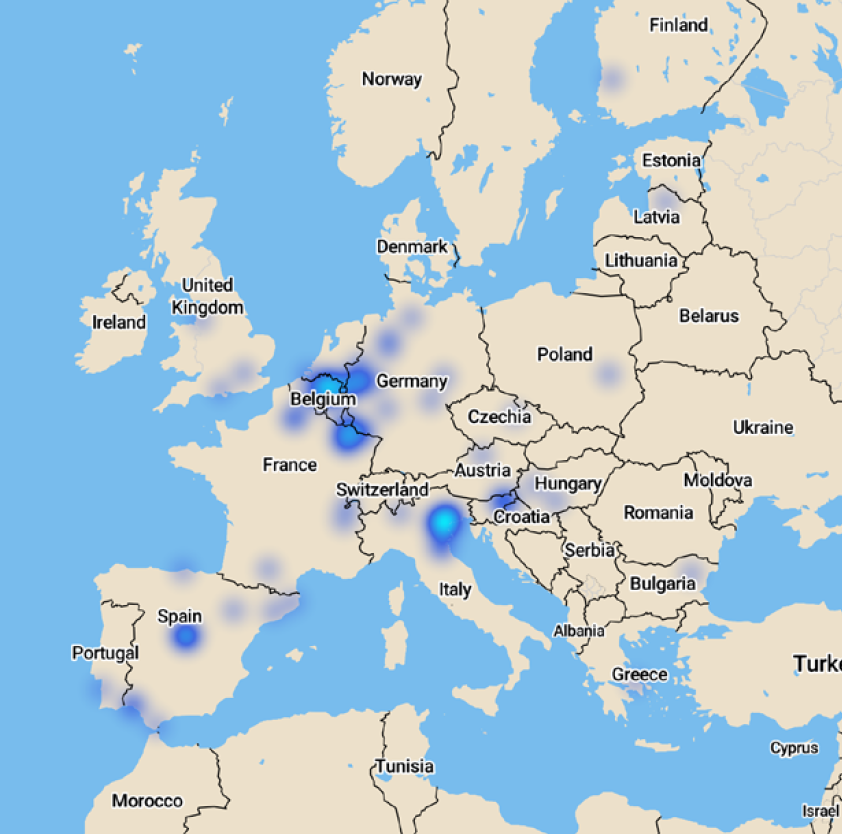
Source :
Fondation pour l’innovation politique; data from the Official Journal of the European Union, Google Maps, Mapbox, OpenStreetMap.
However, these cases do not even represent a third of the total (27%), as companies frequently use associations or ad hoc committees to file their complaints in Brussels. We therefore identified all of the associations in question and the member companies of each of them when the information was available. Thanks to this method, we managed to cover three-quarters of the new investigations opened in the last ten years. The geographical distribution of complainants confirms the previous observation on their concentration in a few key regions. In addition to those previously identified, we have added Lombardy in Italy and Silesia on the Polish-Czech border.
Location of the head offices of the complaining companies named or members of a European association representing their interests
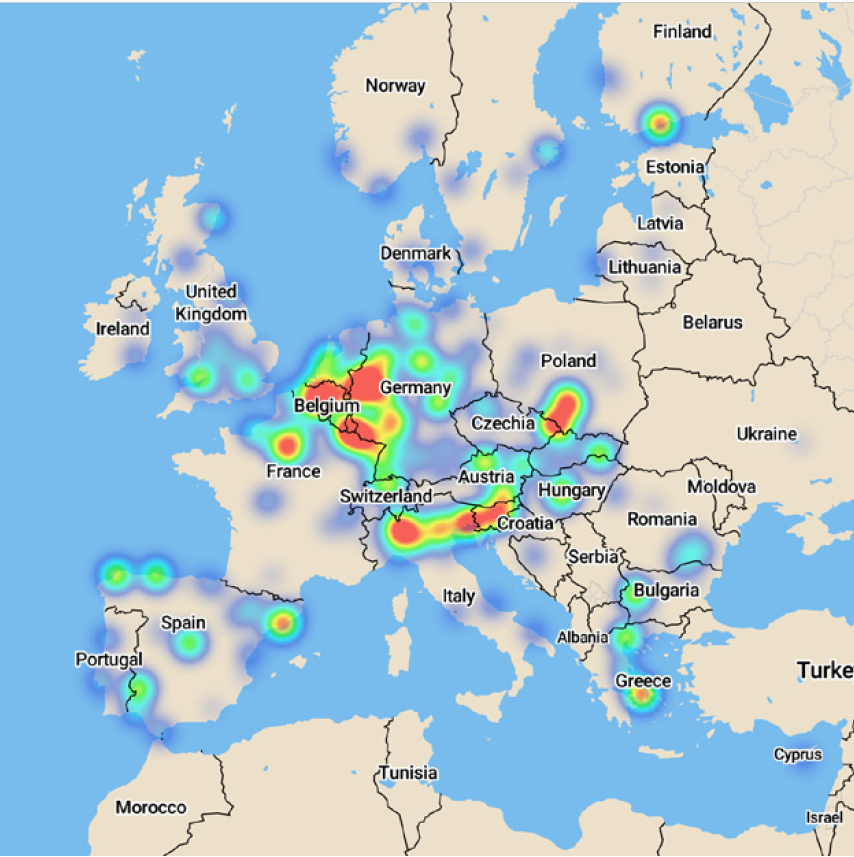
Source :
Fondation pour l’innovation politique; data from the Official Journal of the European Union, Google Maps, Mapbox, OpenStreetMap.
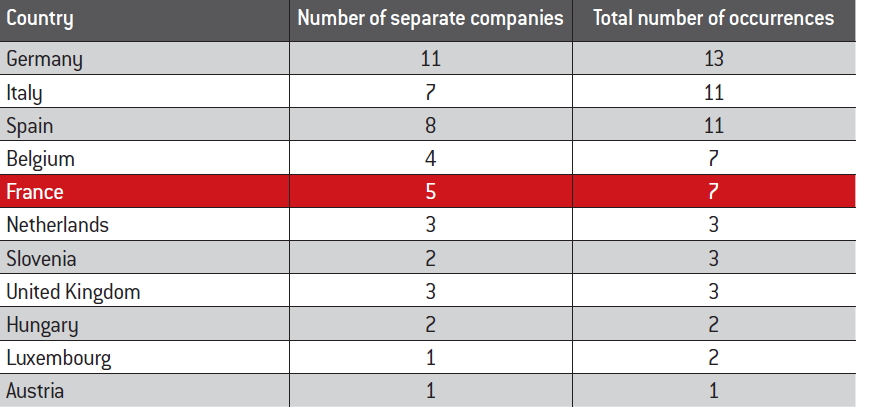
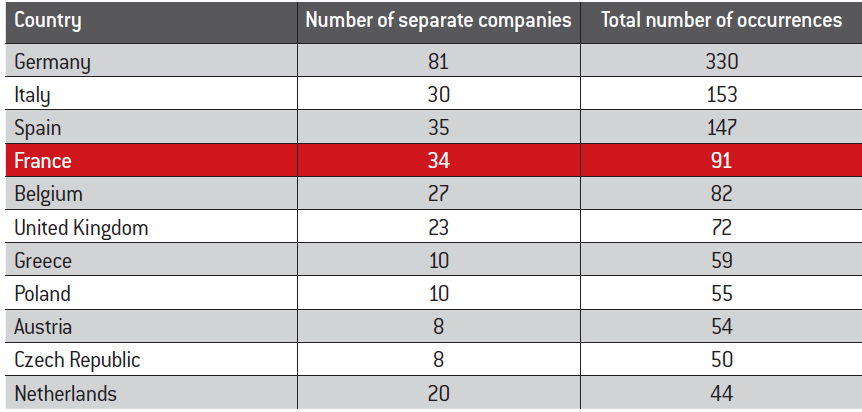
Only five companies based in France appear by name in the cases, compared to seven in Italy, eight in Spain, and eleven in If we consider the total number of occurrences by including the member companies of the European associations filing the complaints, there are 91 cases in France, compared to 147 in Spain, 153 in Italy and more than three times (330) in Germany (refer to the appendices for more details).
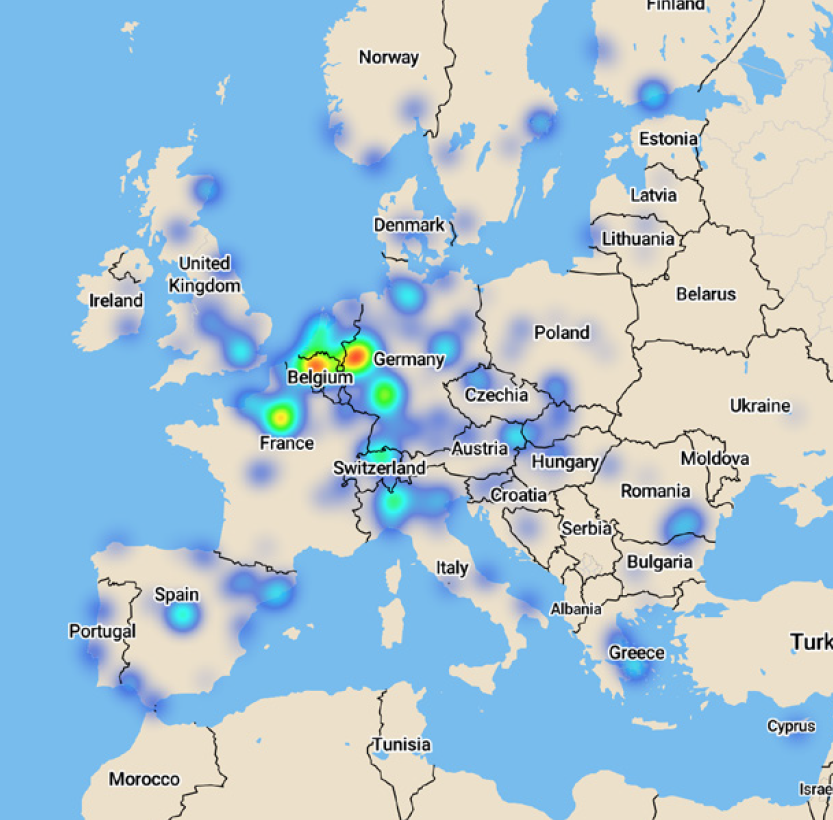
Given the number of cases attributable to Eurofer, the heat map tends to disproportionately show the member companies of this The reader may thus refer to the appendices to examine a heat map excluding Eurofer cases.
The cases of France and Germany invite us to be careful about the theories of regulatory capture in the matter of European trade defence. Indeed, while France tends to be politically pro-commercial defence, French industrialists seem to be relatively underrepresented in cases opened by the European Commission32. On the other hand, Germany, which for a long time has had a strong stance against trade defence, sees its industrialists very well-represented with 330 occurrences compared to only 91 in France over the studied period.
In any case, let us note the clearly essential role of European producers’ associations in the constitution and reporting of complaints at the level of the European Commission. The Eurofer association representing European steel producers alone is responsible for 18% of new complaints opened over the last ten years in the European Union33.
European producers’ associations responsible for cases opened by the European Commission over 2009-2019
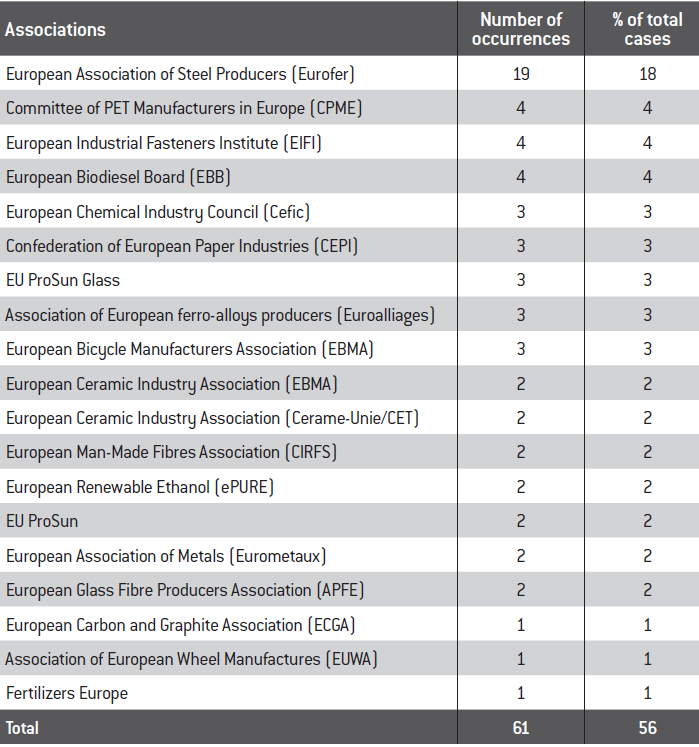
Source :
Fondation pour l’innovation politique; data Official Journal of the European Union.
Other statistics could have fruitfully been added to this insight. Of particular interest would be the data on the exact size of the protected companies, as well as the number of complaints filed by European industrialists that did not lead to the opening of an investigation, or the positions of the Council during the examination procedures. To date, these data are unfortunately confidential. With regard to the positions of the Council, the regulations of the European Commission simply indicate whether the position adopted is “in accordance with the opinion of the committee” composed of representatives of Member States or if the latter has “not issued an opinion”. The committee does not issue opinions in almost a third of cases. On the other hand, it is impossible to know to what extent the discussions and any objections raised within them have influenced the final position of the European Commission – which is anyways de facto always dependant on the opinion of the committee, which makes the final call.
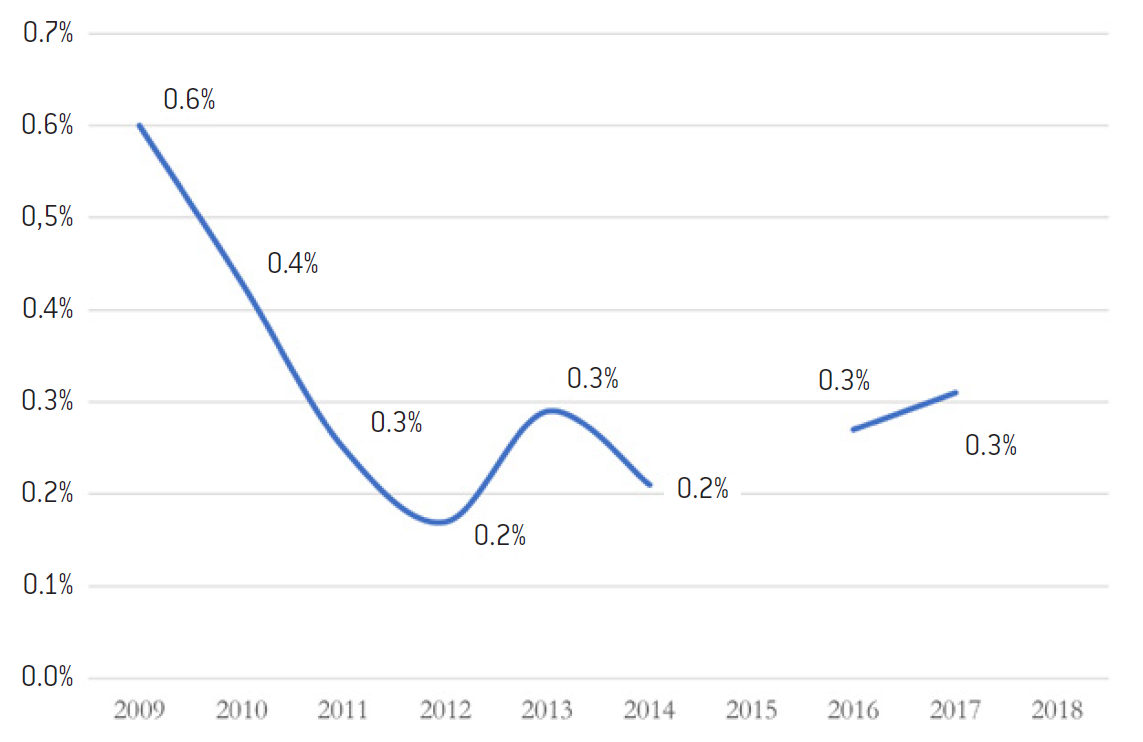
A slowdown in European trade defence? To conclude, two trends can be highlighted: on the one hand, the decline in the number of new investigations (anti-dumping and anti-subsidy) initiated by the European Commission over the period 2009-2018; on the other, the decrease on the share of EU imports subject to anti-dumping or countervailing duties. Should we worry about that? There is no easy answer to this question, but this topic should be matter of concern at a time when the Americans are clearly strengthening their defence arsenal as we have seen.
New anti-dumping and anti-subsidy investigations initiated by the European Commission (excluding the re-openings of past investigations)
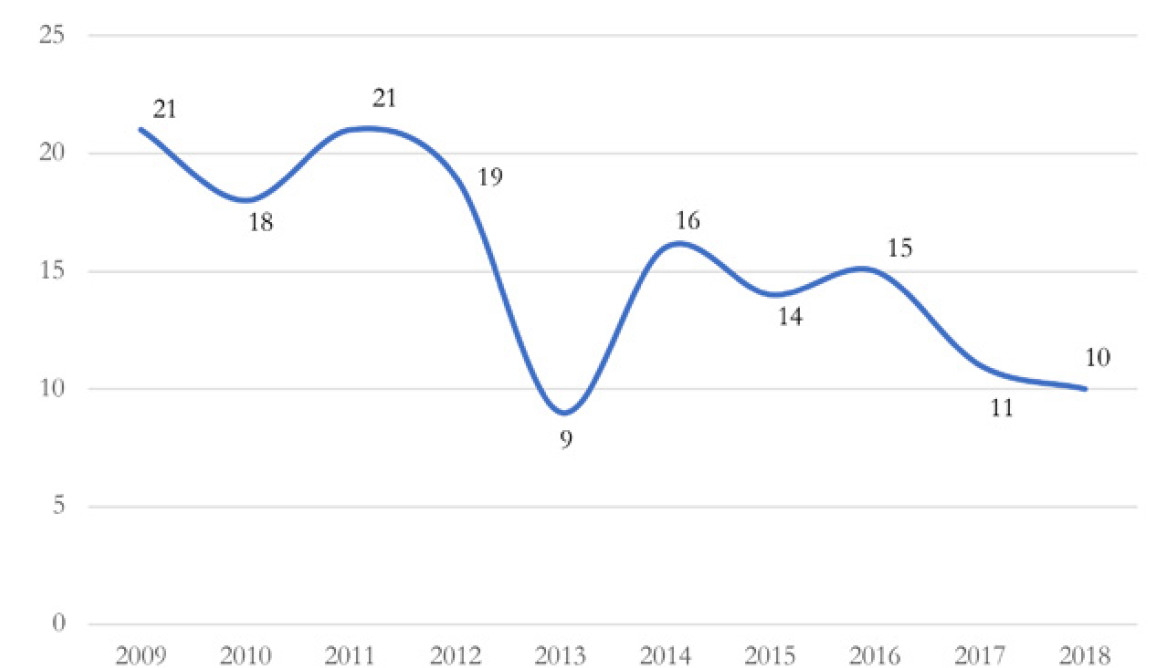
Source :
Official Journal of the European Union.
Share of total imports into the European Union affected by anti-dumping and anti-subsidy duties
Source :
Source: Annual reports from the European Commission to the Council and the European Parliament on the European Union’s anti-dumping, anti-subsidy and safeguard activities.
Note: Data for the years 2015 and 2018 are missing as they are not disclosed in the annual reports.
The regulatory and institutional specificities of European trade defence
Regulation from 11 March 2015 on common rules for imports (safeguard measures), Regulation from 8 June 2016 on protection against dumped imports and Regulation from 8 June 2016 on protection against subsidised The last two texts have since been amended.
See European Commission, “The EU’s new trade defence rules and first country report”, fact sheet Information sheet, 20 December 2017 and “EU modernises its trade defence instruments”, Memo, 23 January 2018,
In particular, by allowing the European Commission, for certain inputs, to calculate the market price from comparable third party countries
A special helpdesk was set up in 2004 by the European Commission to help SMEs to overcome the challenges they may face during trade defence investigations due to their limited resources and their fragmentation on European territory. In 2018, a dedicated website was created by the European Commission to bring together pieces of advice to companies and a specific guide for SMEs has been put online
In practice, this means that all transactions in which the price of the product on the export market is higher than the price on the domestic market are neglected, which naturally has the effect of biasing down the average price on the export market.
Chad P. Bown and Thomas J. Prusa, “U.S. Antidumping: Much Ado About Zeroing”, in Will Martin and Aaditya Mattoo (eds.), Unfinished Business? The WTO’s Doha Agenda, by, CEPR-The World Bank, 2011, p. 355-392
Bruce Blonigen, “Evolving Discretionary Practices of U.S. Antidumping Activity”, Canadian Journal of Economics, vol. 39, n°3, p. 874-900, August 2006.
It should be noted that this procedure also applies to the extension of existing anti-dumping or anti-subsidy measures
In order to understand the European Union’s relatively moderate interventionism in trade defence compared to the United States, it is important to bear in mind the differences, both regulatory and institutional, that exist in European and American anti-dumping and anti-subsidy legislation.
A European “over-transposition” of multilateral rules (WTO+). The WTO rules presented at the beginning of this study provide a multilateral framework from which each country must set up its own system of trade defence mechanisms and procedures. In European law, these are governed by three regulations34, each detailing the procedure relating to a defence instrument. Europe has gone beyond what was imposed by the WTO since these regulations include additional requirements.
Firstly, where the WTO agreements required only three conditions to implement a measure to combat unfair foreign competition (evidence of dumping or subsidisation, injury to the domestic industry, and a causal link between the two), Europe added a fourth one known as the “interest of the Union” test. This requires that the interests of all the European parties involved, i.e. not only EU producers affected by the unfair competitive practice, but also importers, manufacturers in the upstream and downstream sectors, as well as consumers. In fact, it must be noted that an unfair practice systematically penalises European manufacturers producing the imported good, but certainly favours European industrialists and consumers buying the same merchandise since its price is lower than the one that would prevail otherwise. Under the “interest of the Union” test, the Directorate-General for Trade of the European Commission – which is in charge of anti-dumping and anti-subsidy investigations – must assess the impacts of the introduction of a possible defence measure on all these actors, and deduce from it whether such instrument would be in the interest of the European Union or not.
In addition, Europe has introduced the “lesser duty rule”, according to which instruments to combat unfair competition must tax dumped or subsidised products at the level of the injury suffered by the European industry, rather than at the actual rate of dumping or subsidisation. This means that a lower customs duty will be imposed, based on an estimate of the damage suffered by the complaining companies and not on the objective level of dumping. This rule was introduced in order to avoid taxing the part of the dumping that does not distort competition and to protect the interests of consumers.
The European Union’s trade defence instruments have been subject to modernisation in 201835. The lesser duty rule has been removed in anti-subsidy cases as well as in some anti-dumping cases. In addition, a new calculation methodology allows for better treatment of dumping cases from countries with non-market economies36. Finally, the time taken to process cases has been slightly shortened and the mechanism to facilitate access to trade defence for SMEs has been strengthened37. Despite these recent easing measures, the European Union still retains a form of “over-transposition” of WTO conditions. This state of affairs is the result of a compromise between Member States which, as we have seen, do not all attach the same importance to the need for trade defence according to their economic interests and political cultures.
For its part, the United States does not bother with additional rules to the WTO ones. Worse still, many WTO disputes are linked to the U.S. administration’s discretionary methods for calculating dumping margins. Thus, the problem most often contested before the WTO is the American practice of zeroing. This technique allows for the elimination or reduction to zero of the negative dumping margins in the calculation of the average margin over a given period38. As a result, it leads the United States to find higher dumping margins than its foreign counterparts in almost all cases under investigation, and therefore to impose higher anti-dumping duties. Researchers estimate that about 25% of the anti-dumping cases pending in the United States would have resulted in a finding of no dumping if the zeroing method had not been used39. At the same time, another study shows that the evolution of discretionary methods (zeroing and others) applied by the U.S. administration is the main reason why the dumping margins found in U.S. investigations increased on average from 15 to 60% between 1980 and 200040. These elements invite us to take a step back and consider the relevance of reproducing the American model in Europe. The United States may be relatively more proactive than the European Union in trade defence for the wrong reasons.
A different institutional functioning. After examining the differences between the European Union and the United States, let us focus on institutional differences. In the European Union, two institutions are at work in the field of trade defence: the European Commission and the Council. As we will see, the procedure is characterised by close control by the Council over the Commission.
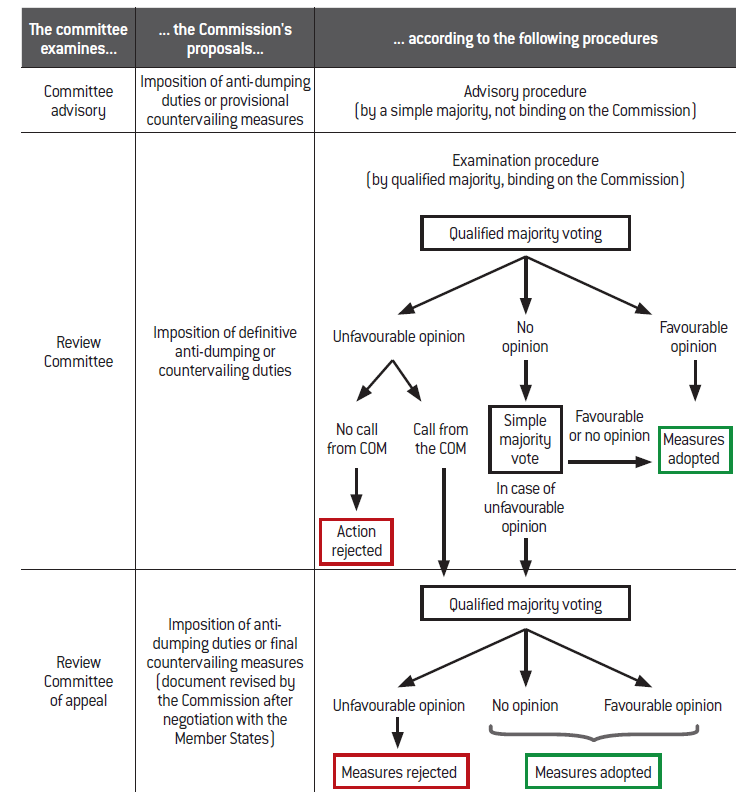
In practice, the European Commission’s Directorate-General for Trade is responsible for carrying out the investigations alone. An “advisory committee”, composed of representatives of the Member States and chaired by a representative of the European Commission who has no voting rights, is called in at regular intervals during these investigations. In the case of a new investigation, the committee can, at this stage of the procedure, only give its opinion on the relevance of provisional anti-dumping or countervailing measures. From the European Commission’s point of view, this stage is therefore purely consultative in that the Commission is free to proceed as it sees fit. On the other hand, before imposing definitive duties, the European Commission must submit to the Council a proposal for implementing a regulation. This examination procedure is imposed on the Commission and its outcome is determined by a vote of the representatives of the Member States by a qualified majority41. The Commission is also not in a position to terminate an investigative procedure without the approval of the Council. In case of the rejection of its proposal, the Commission may appeal against this decision. A new phase of negotiations with Member States then begins. In principle, this leads to a new proposal which is approved or definitively rejected by a qualified majority vote (see the following diagram for a summary of the European institutional procedure).
Outline of the European decision-making procedure in anti-dumping and anti-subsidy cases
Source :
Fondation pour l’innovation politique.
See United States International Trade Commission, “Understanding antidumping & countervailing duty Investigations”
In the United States, two institutions are also at work, but their roles differ significantly from what is in place in the European Union. The U.S. Department of Commerce through the International Trade Administration (ITA) is responsible for establishing the presence of a dumping practice or subsidisation as well as assessing the dumping margin or the amount of the associated subsidy, while the analysis of the existence of injury and causation is the responsibility of an independent agency, the International Trade Commission (ITC). It is composed of six Commissioners appointed by the President of the United States and confirmed by the Senate for a non-renewable nine-year term. The law writes that companies must simultaneously file their complaints with the competent services of both institutions. It is interesting to note that the ITC has, as an independent agency, important prerogatives. If it determines during the preliminary investigation phase that industry injury is not probable, the case is automatically closed. In other words, the ITA of the Department of Commerce can only continue its work with the ITC’s approval. Similarly, at the end of the final phase of the investigation, the U.S. Secretary of Commerce can only validate the imposition of anti-dumping or countervailing duties if the ITC confirms the existence of a proven injury42. In short, the competent American authorities share the processing surveys with very distinct roles, unlike the European model where the Directorate-General for Trade is responsible for the entire workload. The ITC also seems to be less subject to political discretion than the Commission whose entire work depends on the final approval of the Council. It cannot be ruled out that more moderate interventionism of the European Union in the field of trade defence derives from ideological divisions that undermine the unity of the Council’s committee. We will come back to this point in our recommendations.
In light of previous analyses, it seems to us that the European Union could be more assertive in cracking down on the anti-competitive practices of its trading partners. Considering the way in which the Chinese economy operates and the small number of countervailing duties in effect in Europe, it is likely that the major portion of Chinese subsidies are currently passing under the radar of European authorities. The firmness of competition policy within a given economic area must, in principle, be matched by the firmness of its trade defence at its borders, so as to maintain incentives to produce in the territory in question. Therefore, the question of whether European companies are sufficiently protected or not arises. The issue will be at the core of the third – and last – study in this series.
Geographical targets for defence instruments, in number of measures in force at the end of 201
European defense instruments
Source :
Fondation pour l’innovation politique; WTO data.
U.S. defence instruments
Source :
Fondation pour l’innovation politique; WTO data.
Sectoral targets for defence instruments, in number of measures in force at the end of 2018
European defense instruments
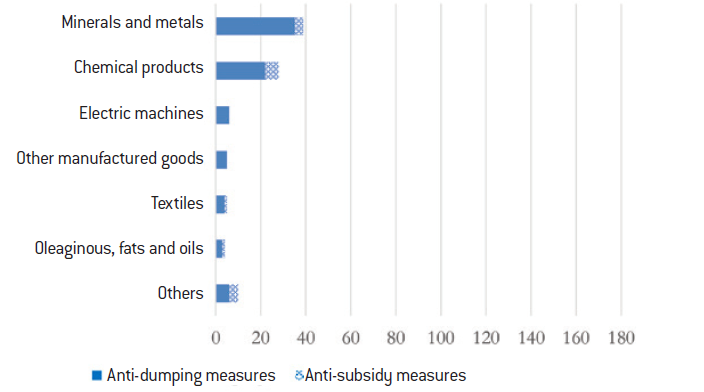
Source :
Fondation pour l’innovation politique; WTO data.
U.S. defence instruments
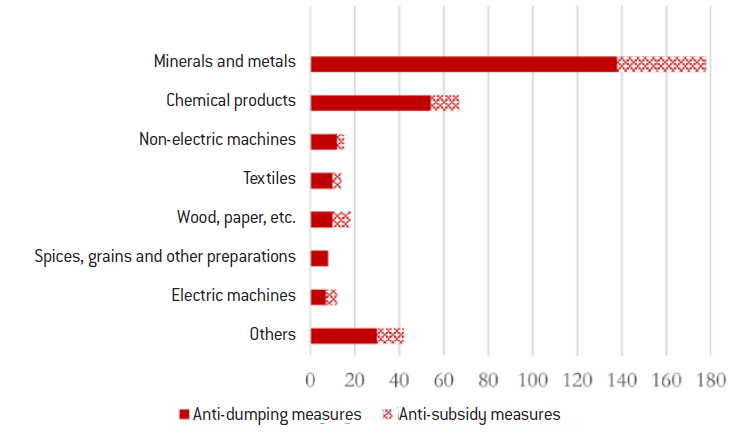
Source :
Fondation pour l’innovation politique; WTO data.
Geographical and sectoral breakdown of new anti-dumping and anti-subsidy cases opened by the European Commission over the last ten years
The top five exporting countries targeted by the investigations opened by the European Commission over the last ten years are, in descending order, China (41% of new investigations), India (11%), Russia (5%), Turkey (4.5%) and Indonesia (4%).
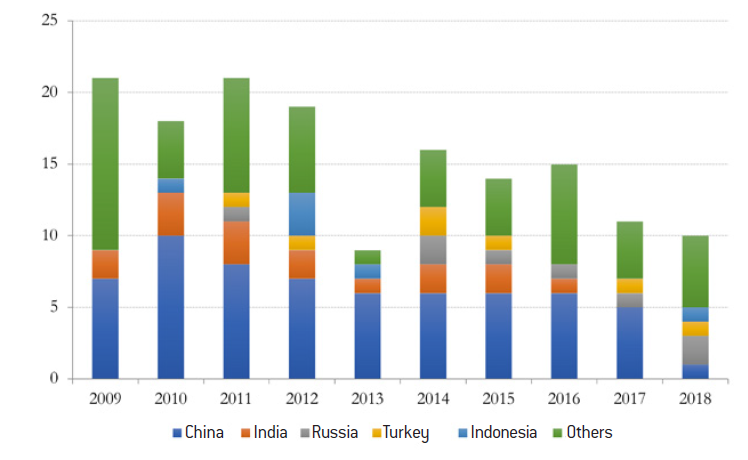
Source :
Fondation pour l’innovation politique; WTO data.
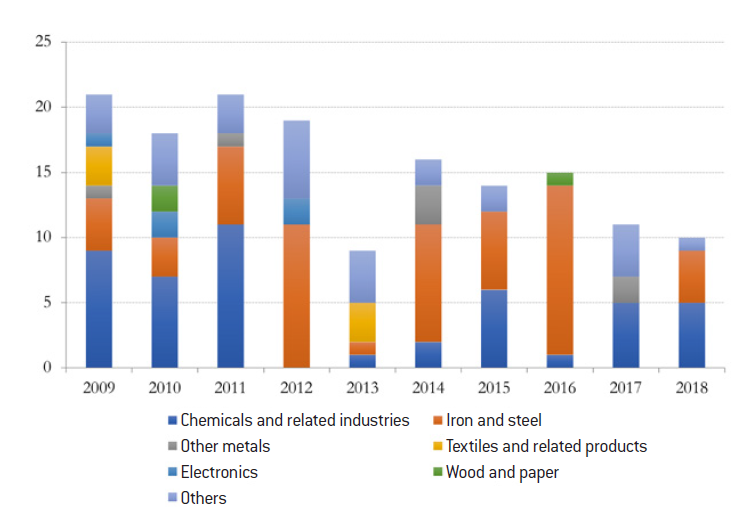
Source :
Fondation pour l’innovation politique; data from the Official Journal of the European Union.
Trade defence instruments: number of measures in force per importing country (base 1 in 2000)
Source :
Fondation pour l’innovation politique; WTO data.
Location of the registered offices of the complaining companies named or members of a European association representing their interests, excluding Eurofer
Source :
Fondation pour l’innovation politique; data from the Official Journal of the European Union, Google Maps, Mapbox, OpenStreetMap.
Location of the head offices of the complaining companies named in the anti-dumping and anti-subsidy investigations initiated by the European Commission over the last ten years
Source :
Fondation pour l’innovation politique; data from the Official Journal of the European Union.
Location of the head offices of the complaining companies or members of European associations named in the anti-dumping and anti-subsidy investigations initiated by the European Commission over the last ten years.
Source :
Fondation pour l’innovation politique; data from the Official Journal of the European Union.









No comments.