Reshoring manufacturing after the covid-19 outbreak?
Introduction
The reshoring movement
Vulnerabilities highlighted by the Covid-19 outbreak
Export controls imposed by governments
The case for reshoring
Beware of ready-made solutions
The impossible reshoring of certain value chains
The specialisation and geographical fragmentation of value chains create mutual dependencies, most often non-problematic
An agenda targeted towards value creation rather than reshoring of old industries
Allocating resources to the development of promising sectors
The semiconductor industry
The cloud industry
Conclusion
Appendix A
Appendix B
Summary
The Covid-19 crisis has highlighted our reliance on imports for the consumption of basic goods, such as protective masks during a pandemic caused by a respiratory virus. This has led to a movement in favour of “industrial reshoring” which has so far found an echo in various parts of society, often transcending the usual political divides.
In this study, we show that reshoring, understood as the repatriation of industrial production formerly carried out on our territory, should however remain confined to very special cases, for compelling reasons and in the absence of more efficient alternatives such as storage, supply chain diversification or procurement at the European level.
As a society, we could, for example, agree to subsidise redundant production lines for vital goods in crisis time, such as certain health equipment or medication. However, as a general rule, we would benefit above all from focusing not on reshoring old industries but on attracting and developing the industries of the future.
If there is one sector in which we are clearly lagging behind and are caught up in relationships of dependency that could prove problematic, it is undoubtedly that of digital technologies. Therefore, the awareness of the need to create more value and intellectual property on European soil by investing heavily in digital technologies and by training and attracting more talent in computer science and engineering is currently of the essence.
Paul-Adrien Hyppolite,
Corps des Mines engineer and graduate of the École normale supérieure.
Europe in the face of American and Chinese economic nationalisms (1)
Europe in the face of American and Chinese economic nationalisms (2)
Europe in the face of American and Chinese economic nationalisms (3)
Big tech dominance (1): the new financial tycoons
Big tech dominance (2) : a barrier to technological innovation ?
Covid-19 - United States, China and Russia: Great Powers Worry Public Opinion
Paradigm shifts
Don't Waste A Crisis
See Ministère de l’Économie, des Finances et de la relance, “Le plan d’action pour la relocalisation des industries de santé en France“, gouv.fr, 18 June 2020.
The notion of “industrial reshoring” has recently gained momentum in public debate and in various political circles. The coronavirus crisis has indeed led to a rise in anti-globalisation and a pro-reshoring rhetoric among commentators who were previously hesitant, if not completely opposed, to discussing such issues. As a symbol of this notorious change, the French President announced his intention to repatriate paracetamol (acetaminophen) production in the name of the country’s independence and sovereignty1 last June.
How did we get here? The health crisis has highlighted our dependence on imports for the consumption of basic goods, such as protective masks. Many French people were shocked to learn that such basic equipment could not be quickly produced on national soil in sufficient quantities. What lessons can we draw from this experience from the point of view of industrial policy? In particular, how should we tackle the reshoring issue?
In this study, we will start by detailing the arguments that motivate the discourse in favour of industrial reshoring. We will then illustrate, with concrete examples, the limits and difficulties posed by this political ambition. Finally, we will attempt to outline the contours of a forward-looking agenda that would aim to attract and develop value-creating activities in promising sectors rather than to reshore old industries – unless there is a compelling need to.
The reshoring movement
Vulnerabilities highlighted by the Covid-19 outbreak
See OCDE, “The face mask global value chain in the Covid-19 outbreak: evidence and policy lessons“, org, 4 May 2020.
See Shin Watanabe, “China pushes all-out production of face masks in virus fight“, nikkei.com, 19 February 2020.
See “GM’s mask operation: a glimpse into the factory of the coronavirus era“, com, 24 April 2020.
Melitta, the German manufacturer of coffee makers and small household appliances, known for having invented the paper coffee filter, was quickly able to produce masks because the firm had its own non-woven fibre production line, usually used for its production of hoover See Christopher F. Schuetze, “From Coffee Filter to Safety Mask, in a Hurry“, nytimes.com, 10 May 2020.
See Samanth Subramanian, “How the face mask became the world’s most coveted commodity“, com, 28 April 2020.
It is estimated, for example, that demand has increased six fold in See “‘La demande en gel hydroalcoolique s’est accrue d’un facteur 6 à 8’”, interview with Virginie d’Enfert, General Delegate of the French Association of Detergent Industries (Afise), info-chimie.fr, 30 March 2020.
See Adeline Haverland, “Les unités de production de parfums Dior, Guerlain et Givenchy vont fabriquer du gel hydroalcoolique“, usinenouvelle.com, 16 March 2020.
See Adeline Haverland, “Tereos, Pernod .. Comment l’agroalimentaire se mobilise pour produire du gel- hydroalcoolique“, usinenouvelle.com, 18 March 2020.
See Alix Guiho, “Coronavirus : vers une pénurie de produits anesthésiants dans les hôpitaux français ?“, france3-regions.francetvinfo.fr, 7 May 2020.
See Madlen Davies, Rosa Furneaux and Ben Stockton, “Stretched, secret supply chains hold Covid-19 patients’ lives in the balance“, com, 12 May 2020.
Ibid.
Ibid.
The coronavirus crisis has put some production lines, particularly in the healthcare sector, under severe strain due to a sharp increase in global demand and the implementation of export controls by some governments. As we will see from three examples – protective masks, hand sanitizer and anaesthetics – supply has sometimes been able to keep up with demand, but this has not always been the case. The resulting shortages subsequently fuelled the discourse in favour of industrial reshoring, readily presented as the best way to regain lost autonomy.
Protective masks
The very deteriorated public health situation caused by the rapid circulation of Covid-19 in early 2020 logically led to a sharp increase in global demand for certain goods. Perhaps the most striking example was personal protective equipment, first and foremost protective masks. While it is difficult to obtain exact figures, it is estimated that global demand for protective masks suddenly increased tenfold at the beginning of the crisis. The assembling of masks does not seem to have been the main difficulty in the increase in production rates2. Indeed, manufacturing is most often carried out using a technique that is widespread in many industries, namely ultrasound welding, and several manufacturers have been able to quickly adjust their production lines to assemble protective masks, such as BYD (automotive), Foxconn (electronic assembly) or DaddyBaby (diaper manufacturer) in China3, General Motors (automotive) in the United States4 or Melitta (household appliances) in Germany5. The bottleneck appears to have been located upstream in the value chain, particularly in the availability of polypropylene non-woven fibre used for its filtering properties and of which half of the world’s production is made in China6.
The manufacturing process of this oil derivative relies on heavy industrial equipment and it took several months to install and start up new production lines to fill the supply gap. The undersizing of the production capacity for this specific type of fibre therefore explains the world shortage of protective masks. Given the physical constraints mentioned, only a significant storage policy could have alleviated the problem.
Hand sanitizer
Conversely, while the demand for hand sanitizer also increased considerably during the Covid-19 crisis7, supply was quickly able to adapt to the need. The supply chain is indeed much less complex and does not have any particular bottleneck. The production consists of mixing three basic chemicals (ethanol or isopropanol, hydrogen peroxide and glycerine) diluted in water at room temperature. The mixture has therefore been quite easily carried out in France on many industrial sites as well as, albeit on a more modest scale, in pharmacy dispensaries. The example of the major cosmetics brands of the LVMH group starting up production lines in a few days to face the risk of a shortage has had a certain media impact in France8. Tensions on inputs such as isopropanol were certainly noted at the height of the crisis, but the existence of a substitute such as ethanol has enabled certain manufacturers to redirect their production and other industries to take over9.
Medication
There was also an unusual demand for some of the drugs used to treat people affected by the virus. This has been the case, for example, with anaesthetics such as hypnotics, which can put patients into an artificial coma, or muscle paralysers, which are needed to support artificial ventilation10. Observers have pointed out that the demand for propofol, one of the most widely used hypnotics, increased fivefold in some regions at the peak of the crisis11. The Italian authorities, frightened by the rate of consumption of the drug, reportedly even requisitioned stocks stored on their soil and destined for Mexico12. A study of the propofol value chain reveals, here again, the great difficulties of scaling up production.
The synthesis of its active ingredient is said to be particularly complex and only carried out by five companies, two of which are based in Europe (in Italy and Switzerland), one in the United States and two in India13.
Export controls imposed by governments
Examples include the measures adopted by Taiwan on 24 January, by Germany on 4 March, by France on 6 March and by the United States on 7 April.
European Commission, “Commission publishes guidance on export requirements for personal protective equipment“, ec.europa.eu, 20 March 2020.
See Francesco Guarascio and Philip Blenkinsop, “EU fails to persuade France, Germany to lift coronavirus health gear controls“, com, 6 March 2020, and Lara Marlowe, “Coronavirus: European solidarity sidelined as French interests take priority“, irishtimes.com, 30 March 2020.
See Jan Dahinten and Matthias Wabl, “Germany Faces Backlash From Neighbors Over Mask Export Ban“, com, 9 March 2020.
See “Coronavirus : la République tchèque saisit des masques destinés à l’Italie”, fr, 22 March 2020.
See Nathaniel Taplin, “Why the Richest Country on Earth Can’t Get You a Face Mask “, com, 1 April 2020.
See Samanth Subramanian, art. cit.
See Ana Swanson, Zolan Kanno-Youngs and Maggie Haberman, “Trump Seeks to Block 3M Mask Exports and Grab Masks From Its Overseas Customers“, nytimes.com, 3 April 2020.
See Scott Anderson and Chelsea Gomez, “Canadian government shopping for high-demand N95 masks on the international market “, ca, 1 April 2020.
See “Coronavirus: US ‘wants 3M to end mask exports to Canada and Latin America‘”, com, 3 April 2020.
See James Politi, “Trump reaches respirator mask deal with 3M“, com, 7 April 2020.
See Anatoly Medetsky, “Russia Starts Some Food Export Curbs, Weighs Further Limits“, com, 23 March 2020.
See “Vietnam halts new rice export contracts as it reviews stocks“, com, 25 March 2020. For other examples of export restrictions in the food sector, see, for example, Cullen S. Hendrix, “Wrong tools, wrong time: Food export bans in the time of Covid-19“, piie.com, 30 March 2020.
Another stress factor for supply chains has been added to the sharp increase in demand for some specific goods, namely the implementation of export controls and the requisitioning of stocks and productive capacities by some governments.
The example of protective masks is once again enlightening. Exports were subject to numerous government restrictions at the height of the crisis. As of mid-April 2020, the OECD counted 43 countries with such export controls in place, including three-quarters of G2014 members. The European Union introduced an export licensing system on 15 March 2020 through a regulation “making the exportation of certain products subject to the production of an export authorisation15” to cover personal protective equipment used to fight the Covid-19 outbreak (protective goggles and visors, face shields, protective clothing, oral-nasal protective equipment and gloves, etc.). This European initiative was actually set up to combat national restrictions introduced by member countries within the European Union itself. France and Germany had come under strong criticism at the European level after their export restrictions had put their neighbours in trouble16. In particular, Germany had come under fire from the United States and the Austria following the blocking of a road convoy of masks17. Finally, various incidents caused a stir in the European press, such as the seizure by the Czech Republic of masks imported from China for Italy18.
China also intervened during the crisis to limit exports of some essential products, including the famous polypropylene non-woven fibre, which is critical for the production of high-quality protective masks. Through this unilateral action, which in early February caused panic among international consumers of the fibre, China was able to increase its mask production capacity at the expense of other countries. Whereas before the crisis it had only half of the world’s capacity, this proportion quickly rose to 85%19. As for the protective masks themselves, the Chinese government also implemented export controls in February in order to give priority to national needs, while at the same time organising the massive import of masks produced abroad20. These restrictions were relaxed in mid-March, when international needs became acute and the Chinese health situation returned under control.
The United States has not been outdone either. A standoff between President Trump and 3M, an American conglomerate famous for its protective masks, received a lot of media attention21. Outraged that the company was exporting masks to Canada and Latin America at a time when the United States experienced shortages, the U.S. President threatened to block these exports on the basis of the Defense Production Act, a federal law dating from the first Korean War which allows the President to pre-empt any material “essential to national defense” and order an increase in its production. Canada, which does not have manufacturing capacities for respiratory protective masks (RPMs) on its soil22, could have ended up in an extremely delicate situation had exports from the United States suddenly stopped23.
An agreement was eventually reached between the U.S. executive branch and 3M, with the company committing to deliver 166.5 million protective face masks to the United States within three months, in exchange for the possibility of continuing to export them to its foreign customers24.
Restrictions on agricultural products
It should be noted that export controls were not limited to healthcare equipment at the height of the crisis. Against the background of fears of food shortages, Russia, the world’s largest exporter of wheat, for example, banned the export of certain cereals for a period of ten days on 20 March25.
Similarly, the Vietnamese government blocked the signing of any new rice export contracts a few days later to determine whether domestic stocks would be sufficient to meet domestic needs during the pandemic26.
The case for reshoring
On this topic, see Phillipe Aghion and Élie Cohen, “Coronavirus : pourquoi l’Allemagne dispose de tests et pas la France”, Les Echos, 30 March 2020.
Two-thirds of the companies would not know their Tier 2 and Tier 3 suppliers (see Peter Guarraia, “Corporate supply chains vulnerable to coronavirus shocks”, Financial Times, 8 March 2020).
See Catherine Shu, “TSMC reportedly stops taking orders from Huawei after new S. export controls“, techcrunch.com, 18 May 2020.
See Alexandra Alper, Toby Sterling and Stephen Nellis, “Trump administration pressed Dutch hard to cancel China chip-equipment sale: sources“, com, 6 January 2020.
These unilateral actions are all the more worrying because that the production of several vital goods is nowadays extremely geographically concentrated. By highlighting specific tensions on international supply chains, the Covid-19 crisis has caused an upsurge in public debate of the rhetoric in favour of industrial reshoring. Three main arguments are essentially put forward by reshoring advocates.
Firstly, the “offshoring” of manufacturing sites to emerging markets, facilitated by the opening up of the world economy, has reduced the domestic production capacities of the richest countries. In France in particular, many citizens see this as the reason for the country’s difficulties in coping with the health crisis at the peak of the virus’ circulation in March-April 2020. The scarcity of personal protective equipment and medical devices such as respiratory devices, or the inability to carry out more tests due to the lack of sufficient reagents and suitable infrastructures have appeared to some as consequences of de-industrialisation. Conversely, according to these same people, the strength of the German industry would have enabled the country to better manage the crisis27.
Rebuilding production capacity in key sectors such as healthcare would therefore be key to dealing with future crises more effectively.
Secondly, the exacerbation of geopolitical tensions on the international scene and the rise of national egoisms have raised with new acuteness the threat of unilateral actions, such as the use of export control instruments, with potentially dramatic consequences in times of crisis. In this context, relying on foreign powers for the import of critical goods or services no longer seems acceptable to many. Hence, it would therefore be necessary for France to house more factories and industrial know-how on its soil to control the production of vital goods.
Thirdly, the fragmentation of production across countries along international value chains can generate bottlenecks and hinder the increase in production rate of essential goods such as masks or respiratory devices when their demand suddenly increases in times of crisis. Indeed, it only takes a failure at a single step in a supply chain to bring it to a complete standstill. Moreover, international supply chains have reached such a level of complexity that even business leaders are often unaware of their suppliers beyond the first tier28. A drastic simplification – if not a complete undoing – of certain value chains would thus be required to increase France’s capacity to resist shocks.
These three arguments were, however, already present in the public debate before the health crisis, and the crisis only gave them resonance with a wider public. Many elected officials, trade unions, business leaders and economists were already warning of the social and strategic risks of offshoring. Moreover, pre-existing tensions between the United States and China over technological supremacy had highlighted problematic dependencies at the industrial level and showed that export controls could be used as a means of political pressure. For example, the restrictions imposed by the Trump administration on the Chinese mobile and telecommunications giant Huawei have had a major impact, with leading technology companies such as Google, Cadence and TSMC having to comply with the demands of the U.S. executive branch29. Pressure from the U.S. executive was even reportedly exerted on Dutch authorities to block the export by ASML of state-of-the-art equipment for Chinese semiconductor companies30.
These measures are not just the prerogative of the Trump Administration, since his predecessor Barack Obama had already banned sales of certain Intel, Nvidia and AMD chips to the Chinese authorities in 2015 in order to slow down China’s progress in supercomputing.
In this worrisome context, the question arises for France and Europe of the possible reshoring of certain industrial activities. Which activities should be targeted as a priority? According to what method and timeline?
Beware of ready-made solutions
Let us now discuss the limits of reshoring policy. An examination of the realities of international trade suggests that the issue of reshoring should be confined to very specific cases.
The impossible reshoring of certain value chains
An extensive reshoring policy would require a radical unravelling of the international trade relations and value chains that now structure the global production of most industrial goods. Regardless of one’s opinion on the merits of such an undertaking, such a policy would in practice be out of reach in many sectors for geographical, technological or economic reasons.
Geographical constraints
The energy sector probably best illustrates this reality. French and European energy supply, a key strategic issue, is essentially based on the import of raw materials whose extraction is not “relocatable” given the unequal distribution of deposits.
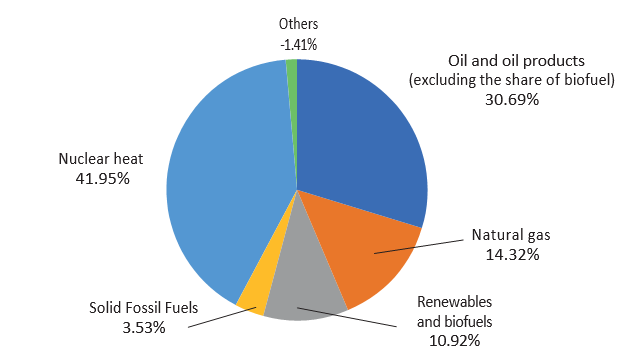
Energy mix in France: gross available energy by source in 2018
Copyright :
© Fondation pour l’innovation politique, November 2020.
Source :
Eurostat.
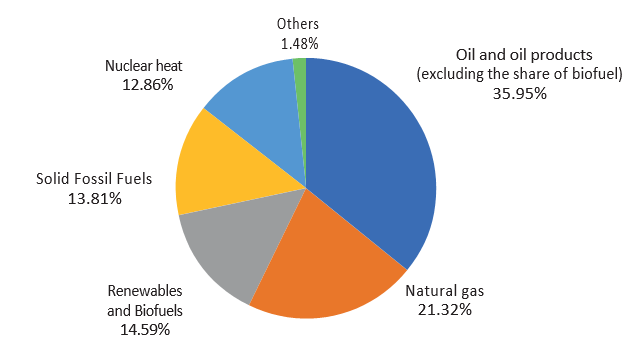
Energy mix in the EU-27: gross available energy by source in 2018
Copyright :
© Fondation pour l’innovation politique, November 2020.
Source :
Eurostat.
The energy we consume comes mainly from fossil (oil, gas, coal) and nuclear (uranium) fuels: 84% for France and 91% for the European Union. An analysis of world production of these fuels reveals, unsurprisingly, that Europe is highly dependent on imports for its domestic consumption.
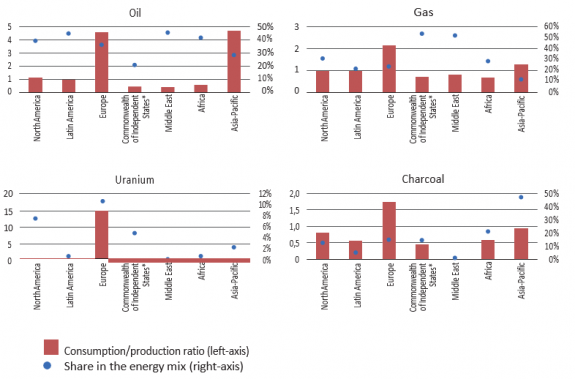
The available data even show that the European continent is the geographical area with the largest quantities of imported fuels relative to its consumption: 45% of European coal consumption, 54% of gas consumption, 80% of oil consumption and 95% of uranium consumption were based on imported resources in 2018. Even if the development of renewable energies could increase Europe’s energy self-sufficiency, it is clear that perfect autonomy, even in the long-term, is illusory.
The Commonwealth of Independent States (CIS) is composed of Azerbaijan, Armenia, Belarus, Kazakhstan, Kyrgyzstan, Moldova, Russia, Tajikistan, Turkmenistan (as an associated state), Uzbekistan and Uzbekistan.
Share in the energy mix and ratio between consumption and production of the four main energy sources
© Fondation pour l’innovation politique, November 2020.
Source: BP Statistical Review of World Energy, June 2019 (author’s calculations).
Junie Lin, “Global LCD TV penetration rate expected to reach 95% by 2014“, Independant Commodity Intelligence Services, 14 April 2014.
Approximately 50% of the market, compared with only 1-2% for TV See Kim Young-won, “OLED to outpace LCD for smartphones in 2019: IHS,” theinvestor.co.kr, August 24, 2018, and “IHS: global OLED TV sales reached 1.1 million in Q4 2019,” oled-info.com, March 3, 2020.
See Philippe Le Cœur, “Thomson investit dans les écrans à plasma pour les futurs téléviseurs”, Le Monde, 29 December 1995.
See Gabrielle Serraz, “Thomson supprime son centre de recherche de Moirans“, fr, 28 May 2003.
See Gilles Fontaine, “Comment les Chinois ont ressuscité Thomson“, fr, 6 March 2012.
See Michael Herh, “LG Display’s Share of Global Smartphone OLED Panel Market Tops 10 Percent“, co.kr, 13 mars 2020.
See “IHS: global OLED TV sales reached 1 million in Q4 2019”, art. cit.
See Wang Jing, Yang Die and Mo Yelin, “BOE Technology to Build $7 Billion LCD Plant in Wuhan“, com, 14 August 2017.
See Kim Eun-jin, “LG Display to Invest Additional 3 Won in OLED TV Panels“, businesskorea.co.kr, 24 July 2019.
It seems uncertain at the moment whether an LCD production plant will actually see the light of Foxconn would rather open an R&D centre. See Jess Macy Yu and Karl Plume, “Exclusive: Foxconn reconsidering plans to make LCD panels at Wisconsin plant“, reuters.com, 30 January 2019.
Agence nationale de sécurité du médicament et des produits de santé (ANSM), Analyse des ventes de médicaments en France en 2013, June 2014, p.25.
See Jean Berthelot de La Glétais, “Comment le principe actif de Doliprane, Efferalgan et Dafalgan s’est retrouvé délocalisé en Chine et aux États-Unis“, usinenouvelle.com, 18 June 2020.
See Feryel Gadhoum, “Rhodia fermera à la fin 2008 la dernière usine européenne de paracétamol“, fr, 12 March 2008.
See Gareth Macdonald, “Europe’s last paracetamol plant closes its doors“, outsourcing-pharma.com, 6 January 2009.
Technological constraints
The reshoring of the manufacturing of certain goods would also be out of reach for technological reasons. Take, for example, the case of TV screens, computers, tablets or mobile phones. Their “essential” nature is not debated, as these screens are nowadays so necessary to the functioning of our economy.
Four technologies have so far dominated the market:
- cathode ray tube (CRT) screens, from the 1930s to the 2000s;
- plasma screens, from the late 1990s to the mid-2010s ;
- liquid crystal displays (or LCDs), since the 2000s;
- organic light-emitting diode (OLED) screens since the 2000s.
Prior to 2000, the overwhelming majority of TV screens sold were CRT. Today, liquid crystal displays account for 95% of the TV screens market31. Computer monitors have adopted the same technologies, with the exception of plasma, whose characteristics are not suitable for this use. Displays for smartphones are either LCD or OLED, with a significantly higher proportion of OLEDs than for televisions32. Driven by the mobile industry, the market is growing strongly.
France has long produced cathode ray television sets on its soil. Radiotechnique (a subsidiary of CSF and then of the Dutch company Philips), Thomson (now Technicolor) and Schneider Radio-Television (controlled by Philips since 1971) produced hundreds of thousands of television sets in France in the 1960s, notably in Le Mans (Schneider) and Dreux (La Radiotechnique). Asian competition in the 1970s, followed by the arrival of new screen technologies in the 1990s, deeply damaged the French industry. Thomson tried to turn the corner on flat screens by opening a pilot production line for plasma screens at Moirans, in Isère, in partnership with Thomson-CSF (now Thalès)33, but this initiative was unsuccessful34. Philips, long the European leader in the sector, was no more successful and ended up selling its television activities to the Chinese group TPV Technology in 201135. The market is now entirely controlled by Asian manufacturers: BOE Technology (China, 18% of global production capacity), LG Display (South Korea, 17%), Innolux Corporation (Taiwan, 14%), Samsung Display (South Korea, 12%) and AU Optronics (Taiwan, 11%).
The concentration of production capacity is impressive in certain segments: Samsung controls 80% of the market for OLED screens for mobile phones36 and LG Electronics 53% of the market for OLED screens for TV sets37.
The technologies used to manufacture LCD and OLED displays are specific, rapidly evolving and require huge capital investments, for example $7 billion for BOE Technology’s latest LCD plant in Wuhan, China38 and $2.5 billion for a new generation of OLED production lines at the LG Display plant in Paju, South Korea39. Moreover, no European group has had a significant position in this market for at least a decade. Consequently, the technological leap to be made to quickly relocate these activities would in all likelihood be out of reach. The only plausible option would be to attract investment to Europe from Asian companies that today possess the necessary skills and technologies. This is, moreover, what the United States is trying to do with a project to set up a gigantic Foxconn LCD factory in Wisconsin, a plan whose ambition has nevertheless been significantly revised downwards recently40.
Economic constraints
In addition to geographical and technological limitations, there are also economic constraints to be taken into account. Let us take the example of paracetamol, for which the French President Emmanuel Macron has announced the repatriation of part of the production within three years. This molecule is indeed critical since it is the active ingredient present in the composition of the three best-selling drugs in France, Doliprane (Sanofi), Dafalgan (UPSA) and Efferalgan (UPSA)41. It should be noted that during the Covid-19 crisis, the Agence Nationale de Sécurité du Médicament et des Produits de Santé (ANSM) restricted their sale without a prescription in order to guarantee their availability and limit the risks of over-consumption. Although the finished product is still manufactured and packaged in France (in Lisieux and Compiègne for Sanofi, in Agen for UPSA), the paracetamol molecule is however entirely imported because there is no longer a plant capable of synthesising it on European soil42. The last one, owned by Rhodia and located in Roussillon, in Isère, stopped its production line in 2008. In fact, synthesised for the first time in 1878, paracetamol has since become a quasi-commodity on the international markets. The Indian and Chinese production sites, which benefit not only from economies of scale linked to the size of their factories, but also from access to cheap labour and less stringent environmental standards, have exerted very strong pressure on prices. In 2008, Indian and Chinese factories already accounted for 70% of global production.
The director of the French site at Roussillon then reported a considerable competitiveness differential, with Asian prices being one and a half to two times lower43. Neither the pharmaceutical companies consuming the molecule nor the end customers were prepared to bear such a price differential, especially since Asian producers had managed to raise themselves to the highest quality level44.
What conclusions can we draw from this example? There is undeniably a sovereignty issue at stake in our ability to produce an active ingredient that is essential to the health of the French in the event of a sudden and lasting disruption in supply. However, it seems difficult, especially in an unfavourable economic context, to transfer to society the substantial additional cost that would result from a complete repatriation of the production of this analgesic. Such a strategy, applied on a large scale and systematically, i.e. beyond paracetamol, would not be economically viable. The example of this molecule therefore raises the question of the subtle balance to be found between, on the one hand, economic efficiency and robustness and resilience in the event of a crisis on the other.
The specialisation and geographical fragmentation of value chains create mutual dependencies, most often non-problematic
Ministère de l’Agricuture et de l’Alimentation, “Commerce extérieur agricole et agroalimentaire“, Graph’Agri 2019, p.124.
See FranceAgriMer, Les Chiffres-Clés de la filière fruits & légumes frais et transformés, 2019.
See FranceAgriMer, Commerce extérieur des produits de la pêche et de l’aquaculture 2018, 2019.
See Franck Stassi, “Comment la France veut gagner sa souveraineté dans les protéines végétales“, com, 21 January 2020.
See Yohan Blavignat, “Pourquoi la France est-elle si dépendante du soja brésilien ?” fr, 20 September 2019.
See Thierry Pouch, “La balance commerciale agroalimentaire française: excédentaire mais menacée“, vie-publique.fr, 25 November 2019.
See Agnieszka Kumor, “La balance commerciale agroalimentaire de la France est devenue déficitaire”, fr, 5 July 2019, and Eurostat, “EU trade in food”, europa.eu, 16 October 2017.
In the majority of cases, the situation is rarely as clear-cut as in the previous examples. International trade plays a major role in the economy of most countries. The dynamics of specialisation and the distribution of value chains on a global scale create relations of mutual dependence between countries. These interdependencies make the analysis of power relations in international trade very complex. To venture to normative conclusions becomes a risky exercise. To illustrate this, we can take the example of the agro-food industry and personal protective equipment.
The food industry
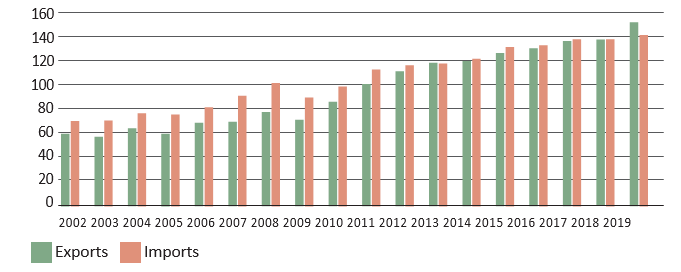
The issue of “food sovereignty” is frequently controversial and voices are regularly raised to point the finger at our dependence on the consumption of certain food products. Thus, for fruit, France has a large and growing trade deficit: minus 3.6 billion euros in 2018, compared with minus 1.9 billion euros in 201045.
France imports strawberries, apricots, cherries and nectarines from Spain, grapes from Italy and kiwis from New Zealand46. The same can be said for fish and shellfish47, with our imports exceeding our exports by 3.5 billion euros (compared to 2.6 billion euros in 2010). Salmon alone, imported mainly from Norway, the United Kingdom and Poland, accounts for a quarter of this deficit. Prawns (16% of the deficit) are mainly imported from Ecuador, India, Vietnam and Madagascar. Finally, France’s agri-food dependence on proteins used in animal feed is worth highlighting, with France producing only 53% of its consumption needs48. It thus imports large quantities of soy, mainly from Brazil (61% in 201749).
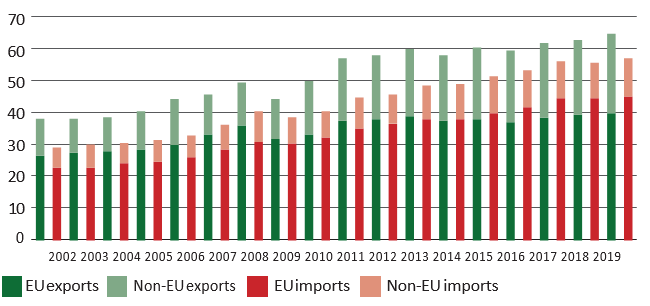
To deduce that we would have lost our food autonomy would, however, be excessive. Every year since 1976, France has been a net exporter of agricultural produce without exception50. Exports are mainly composed of beverages (especially wines and spirits), cereals, milk and dairy products51.
France’s agri-food trade (in billions of euros)
Copyright :
© Fondation pour l’innovation politique, November 2020.
Source :
Eurostat data, first 24 chapters of the Harmonised System.
Extra-EU agri-food trade of the European Union (in billions of euros)
Copyright :
© Fondation pour l’innovation politique, November 2020.
Source :
Eurostat data, first 24 chapters of the Harmonised System.
See Ian Sheldon, “How soybeans became China’s most powerful weapon in Trump’s trade war“, com, 30 May 2019.
See Karen Braun, “Column: Does China still need S. soybeans after Brazil’s export bonanza?“, reuters. com, 23 July 2020.
The company has about a quarter of the world market for respiratory devices (see “Global curbs on medical exports imperil poor nations“, ch, 24 March 2020.
See Peter Siegenthaler, “Swiss ventilator company inundated by demand due to Covid-19“, ch, 17 March 2020, and Sarah Kliff, Adam Satariano, Jessica Silver-Greenberg and Nicholas Kulish, “There Aren’t Enough Ventilators to Cope With the Coronavirus“, nytimes.com, 18 March 2020.
See “Déclaration du Groupe ministériel de coordination sur la Covid-19 au sujet du maintien des liens mondiaux essentielss“, 17 April 2020.
This release means that IEA members can decide together to draw on their strategic oil stocks to meet a temporary need.
See International Energy Agency (IEA), “Oil The global oil market remains vulnerable to a wide range of risk factors“, iea.org, 27 November 2019.
Aymeri de Montesquiou, “L’énergie nucléaire en Europe : union ou confusion ?” Information Report 320, Senate, 2000.
See Hannah Ellis-Petersen, “India limits medicine exports after supplies hit by coronavirus“, theguardian. com, 4 March 2020.
See Nidhi Verma, “India allows export of paracetamol API: statement“, com, 28 May 2020.
Among France’s food dependencies, some seem at first sight more problematic than others. For example, it could reasonably be argued that the country could occasionally do without salmon and prawns while it would be more bothersome to be unable to import proteins, such as soy, which are used in cattle feed. Does this mean that we are dangerously dependent on them? Not necessarily. As proof, China, the largest importer of soybeans with almost two- thirds of world imports, has managed to virtually suspend imports from the U.S. for two years in the context of the trade war between the two countries52.
Whereas in 2016 China imported 44% of its soybeans from the U.S. and 44% from Brazil (worth $32 billion), by 2018 it imported only 10% from the U.S. and 81% from Brazil (worth $34 billion)53. The Chinese government has been trying to reduce its imports of soybeans from the U.S. and Brazil to a level that is more than double the amount it used to import. The need to avoid equating imports with dependence is evident here: competition between exporters can give importers a dominant weight in the balance of power. The case of agro-food products therefore invites us not to draw hasty conclusions about commercial dependency and, by extension, not to confuse independence and autarky.
The counterproductive effects of export controls
These complex relationships of interdependencies between countries were particularly highlighted during the Covid-19 crisis. While many leaders, sometimes under public pressure, adopted measures to restrict the export of essential goods, several observers and economists stressed the pernicious nature of these arrangements.
Indeed, such measures are immediately counterproductive when they jeopardise the functioning of international value chains on which an exporting country A is self-dependent for its own production (if importing country B exports goods or services used upstream of A’s production) or consumption (if B exports finished products or consumables to A). The system of export licences for health protection equipment set up by the European Union on 15 March of this year has been criticised on the basis of such cases. The Peterson Institute for International Economics first noted that Swiss manufacturers exporting essential equipment to the European Union have been impacted by the restrictions. This was notably the case of Hamilton Medical, a major manufacturer of medical respiratory devices54, whose production was for a time hampered by export restrictions on components exported from Romania55. The European Union recognised this and quickly exempted exports to European Free Trade Association countries (Switzerland, Norway, Liechtenstein, Iceland) from licensing.
In response to this, there have been several calls for the preservation of unhindered international trade during the crisis, including from countries that have themselves at one time or another put export restrictions in place, such as France56.
The examples around protective equipment and agro-food illustrate the interdependent relationships which result from trade specialisation. As long as there is no clear dominance in bilateral trade, the balance of power is balanced and the fear of suffering lastingly from the consequences of export control measures seems unfounded. As we have seen, such measures were indeed put in place at the beginning of the crisis but their perverse effects soon became apparent and most of them have since been suspended or relaxed.
Cost-benefit analyses
Even when there are no outstanding obstacles to reshoring, considering the benefits of reshoring without taking into account the associated costs would quickly lead to poor decisions. The question must therefore be asked from the outset as to the impact of the additional costs that reshoring would generate for businesses and society as a whole.
In the case of companies operating in highly competitive sectors where margins are low by definition, reshoring should logically result in price increases for the customers of the companies concerned, otherwise the latter would produce at a loss and would not be long in exiting the market. Would the latter (companies or individuals) then be prepared to accept the negative consequences on their competitiveness or purchasing power in the name of “made in France” for instance? If price increases were acceptable, would the French market be large and deep enough to absorb these additional costs and not jeopardise the competitive positioning of our companies on foreign markets?
Conversely, companies operating in oligopolistic sectors and therefore enjoying higher margins could potentially absorb some if not all of the cost of reshoring. However, internalising these additional costs would mean less financial leeway to invest in future projects (R&D, industrial equipment, mergers and acquisitions, etc.). Oligopolistic market structures are generally found in sectors with strong technological content where the capacity to invest massively conditions the prospects of growth. If France is among the only countries to adopt a reshoring strategy in such sectors, there is a good chance that it would be detrimental to the international competitiveness of its companies, unless it ultimately results in price increases for French customers.
Finally, the risk of trade retaliation remains to be integrated. The problem of reshoring can only be considered in the context of a repeated game, because our commercial partners who would bear the consequences of reshoring would certainly not remain idle. Retaliation policies would first of all penalise our activities dependent on international trade such as luxury goods (cosmetics and ready-to-wear), the agro-food industry (food, wines and spirits) and aeronautics.
The right balance between efficiency, robustness and resilience
The challenge should therefore be to optimise the production system according to three key variables:
- efficiency, defined as a company’s ability to produce by optimising the use of scarce resources or production factors;
- robustness, defined as the ability to withstand a shock;
- Resilience, defined as the ability to quickly bounce back after a shock.
Specialisation according to comparative advantages, the ability to take advantage of increasing returns to scale and network effects, and just-in-time production are typical efficiency factors. On the other hand, the redundancy of certain production lines, inventories and the diversification of suppliers can be factors of robustness and resilience.
The difficulty in optimising value chains according to these three criteria lies in the fact that it is not necessarily in the interest of companies to internalise the constraints of robustness if they anticipate that the public authorities will always help them in difficult times. Moreover, each crisis has its own specificities. A shock can indeed be exogenous or endogenous, sectoral or systemic, domestic, regional or global, as illustrated by the health crisis we are currently experiencing. The factors of robustness and resilience for a given shock can have the opposite effect in the face of another shock. In the event of a domestic or European crisis, international trade with China or India – often seen as a factor of fragility today – would, on the contrary, increase the country’s robustness and resilience. Besides, these factors are often dynamic. While dependence on China for certain imports proved to be problematic at the beginning of the Covid-19 crisis, it turned out to be beneficial when European and then American production sites were subsequently paralysed by the rapid circulation of the virus. We must therefore ensure that the adjustments we make as we emerge from the current crisis do not create the conditions for our fragility in the face of another type of shock.
Alternatives to reshoring
As we will now see from concrete examples, reshoring is not necessarily the alpha and omega of a policy that seeks to increase resilience to shocks.
Oil and uranium illustrate the possibility of a smart storage or common procurement policy for goods that cannot be produced in sufficient quantities domestically. As European energy dependence is nothing new, we can look at the mechanisms that have been put in place in the past to guard against the risk of supply disruptions in the event of a crisis. The 1973 oil shock was, in the energy sector, the equivalent of the Covid-19 crisis in healthcare, i.e. the moment of a collective realisation of our dependency and fragility in a sector that is essential to the functioning of any country. Among the measures taken in response to the 1973 shock was the creation of the International Energy Agency (IEA) under the aegis of the OECD. Member countries, the major developed oil-importing countries, committed to establishing strategic stocks representing at least 90 days of their net oil imports. If the situation so requires, the IEA can decide to “release” these reserves57. This scenario has already materialised on several occasions, including in 1991 during the first Gulf War; in 2005, after Hurricane Katrina hit oil installations in the Gulf of Mexico; and in 2011, at the time of the Libyan War58.
Nuclear fuel supplies have also been the subject of measures designed to protect European countries from possible supply shortages. The Euratom Treaty, signed in 1957, established the Euratom Supply Agency, responsible for centralising all European Union purchases of minerals and fissile materials.
In practice, this agency has apparently never had to fulfil its role to the fullest, as concerns about a shortage of fissile materials prevailing at the time of its creation have so far not materialised59.
On another level, the example of medication is also revealing. The creation of a new production line for an active pharmaceutical ingredient is a long process, requiring the production of several test and validation batches. A marketing authorisation in the pharmaceutical industry does not only concern the content of the medicinal product but also the entire supply chain. Therefore, a pharmaceutical company cannot change its suppliers overnight. The pandemic highlighted this reality when India announced in early March that it was temporarily suspending exports of paracetamol60 (restrictions that were lifted at the end of May61). Considering the criticality of a molecule such as paracetamol, the concentration of its global production – in this case in only two Asian countries – and the time it takes to set up a new production line, a partial reshoring of its production could make sense. In order to limit the additional cost to society, the new (reshored) production units could only produce small volumes in normal times, but their very existence would allow for an increase in production rates if necessary in the event of a crisis. However, it is likely that this approach could not be generalised to all medication, given the additional costs involved. Nonetheless, alternatives do exist, such as encouraging the opening up of production sites in other emerging countries in order to diversify supply, pooling production at European level or building up strategic stocks when the chemical properties of the reagents allow it.
Reshoring must therefore be considered on a case-by-case basis and documented by cost-benefit analyses. Alternative solutions such as storage and supply chain diversification are also not without their drawbacks. Storage, for example, is obviously not a viable solution for perishable materials. Diversification, on the other hand, is currently not an option in many situations where there are simply no alternatives given the dynamics of specialisation and market structures. Diversification also does not offer the same level of security as reshoring in the event of a global crisis.
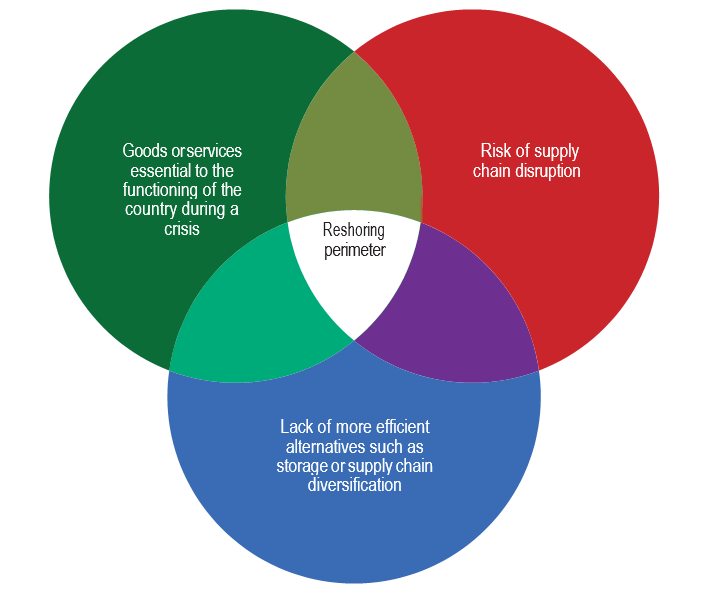
In short, targeted industrial reshoring could make sense if limited to a restricted perimeter of essential goods, for which the risk of supply chain disruption is high in the event of a crisis (health, environmental, economic, geopolitical, etc.) and for which there is no more efficient alternative solution such as storage or supply chain diversification.
Scope of reshoring
Copyright :
© Fondation pour l’innovation politique, November 2020.
An agenda targeted towards value creation rather than reshoring of old industries
Allocating resources to the development of promising sectors
Comparison based on annual total returns with dividends reinvested. See “When Performance Matters: Nasdaq-100 S&P 500 First Quarter ’20“, nasdaq.com, 24 April 2020.
See Ulf Sommer, “Die 500 grössten Konzerne im Vergleich: USA immer stärker – Europa fällt zurück“, handelsblatt.com, 25 June 2020.
Focus on value creation
Unless there is a compelling reason and in the absence of a more efficient alternative solution, the real challenge is therefore not to relocate the production of our day-to-day consumption, but to position ourselves in the value-creating segments of the contemporary economy. This approach is not only relevant from an economic standpoint (as these activities will generate the jobs and profits of tomorrow), but also from a strategic perspective, insofar as they will determine the balance of power on the international scene.
So technologies, like 5G, which some might perceive today as non-essential or even superfluous, will in fact be our vulnerabilities tomorrow if we do not invest massively in their development and industrialisation. The international economy is a set of mutual dependencies within which it is especially important to position ourselves on the segments with the highest added value. Is there any reason to fear a trade war with exporters of raw materials or intermediate products when they depend on our technologies for their production or our exports of final products for their consumption?
European technological breakthroughs
However, for several decades now, Europe has been accumulating a technological gap in digital technologies with respect to the United States and several Asian countries, such as Japan, China, Taiwan and South Korea. This gap now extends from advanced electronics to software. The discrepancy between realised or anticipated profits (reflected by market capitalisations) of large European and American companies illustrates this phenomenon. Some see it as the result of a stricter application of competition policy in the European Union than in the United States, but a comparison of the American stock market reference indices Nasdaq-100 (rich in technological values) and S&P 500 (relatively more oriented towards the traditional economy) invites us to relativize the explanatory power of this theory. Over the period from the end of 2007 to the end of 2019, the performance of the Nasdaq-100 outperformed that of the S&P 500 for ten years out of twelve62.
The cumulative total return of one dollar invested in the Nasdaq-100 at the end of 2007 is now 327%, compared to 128% for the S&P 500. The performance of large American companies is therefore primarily driven by that of technology companies, which in most cases have very few serious European competitors.
Moreover, the Covid-19 crisis, which is accelerating the transition to the digital economy, is likely to further precipitate this relative dropout of European companies. According to a recent study that compared the financial performance of the largest listed companies on both sides of the Atlantic, the profits of the 300 companies in Europe’s top 500 that published their quarterly financial results at the time of the survey fell by 87% in the first three months of 2020, reaching just €11 billion in total63. By comparison, Apple’s profits alone during this period were $11.25 billion. According to estimates by financial analysts, the profits of the U.S. top 500 are expected to fall by 18.5% in 2020 compared to 2019, almost half as much as those of the European top 500. It is difficult not to see the consequences of the American leadership in digital technologies, one of the most value-creating segments in the contemporary economy.
The example of Apple
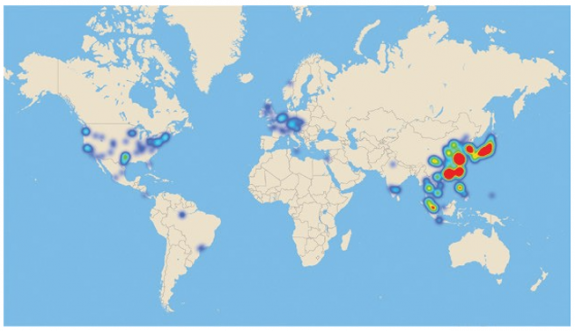
To illustrate Europe’s technological and industrial gap in today’s digital world, the case of Apple, whose market capitalisation today reaches $2 trillion, is notable. The company is positioned downstream of the electronics industry for the general public in several buoyant segments: smartphones, tablets and personal computers on the one hand, but also, and above all, operating systems, app stores and digital services on the other. In this regard, the firm has several American and Asian competitors, such as Google, Samsung or Huawei, but no European competitor of this calibre. Furthermore, the data published annually by the company on its suppliers allows it to reconstruct and map its value chain. It is clear that, unlike Japan, China and Taiwan in particular, Europe has not really been able to take industrial advantage of the development of the technological giants by positioning itself on the upstream part of their value chain.
This heat map shows the location of Apple’s suppliers referenced in the company’s supplier list, which is updated annually and includes Apple’s top 200 suppliers who collectively account for 98% of Apple’s procurement spending. As the weight of these suppliers in the value chain is not known, the geolocation data is thus not weighted.
Distribution of Apple’s supply chain around the world
© Fondation pour l’innovation politique, November 2020.
Source: Apple Supplier List
Awareness of the need to develop intellectual property and create more value in Europe by investing in digital technologies and attracting talent in computer science and engineering is today fundamental. It is vital for Europe’s future not to become locked into an archaic vision of the economy that would put the reshoring of yesterday’s industries ahead of the “localisation” of those of today and tomorrow. To illustrate this, let us now analyse two high value-added segments of the digital technology industry in which European companies are unfortunately too scarce: semiconductors and the cloud.
The semiconductor industry
DRAM: dynamic random access memory; PMU: power management units; CPU: central processing units;GPU: graphics processing units; FPGA: programmable logic circuits.
See “Les ventes de semiconducteurs avec fonctions d’IA devraient tripler d’ici 2025“, net, 30 January 2020.
As an example, a standard smartphone today has much more computing power than the computers used by NASA for the Apollo 11 moon landing in 1969.
At a more granular level, the Koreans SK Hynix and Samsung share most of the DRAM production with the American The Americans Intel and Xilinx share a good part of the FPGA production. The Japanese Toshiba, the Koreans SK Hynix and Samsung, and the Americans Intel and Micron are particularly present in the flash memory segment.
Fab-lites, such as Texas Instruments, NXP or STMicroelectronics, still have their own production sites for older generations of semiconductors but rely on independent contractors such as TSMC or GlobalFoundries for the most sophisticated chips.
In physics, the term “semiconductor” refers to a material, such as silicon, whose electrical conductivity is intermediate between that of a conductor and an insulator. In the industry, the term refers to a small surface with physical properties on which many electronic circuits can be assembled, enabling electrical operations with more reliability, less space and lower cost than vacuum tubes.
The semiconductor industry covers a wide range of electronic chips with diverse applications. Behind technical names or acronyms such as DRAM, NAND flash, photo sensors, PMU, CPU, GPU or FPGA64 are small components with very high added value that equip professional or consumer electronic products, from space launchers to smartphones, cars and video game consoles.
The market size is huge, with sales of semiconductors exceeding $400 billion worldwide in 2019. Some segments are particularly buoyant: IHS Markit for instance forecasts sales of semiconductors used in artificial intelligence applications to triple between 2019 and 2025 (from $43 billion to $129 billion)65.
Ever smaller, cheaper and more efficient66, semiconductors are designed, produced and marketed by a highly competitive industry structured around oligopolies. The Taiwanese TSMC, the Korean Samsung and the American Intel currently have the largest and most sophisticated production capacities67. The pace of technical progress and competition is such that a semiconductor company must work simultaneously on several product ranges at different stages of their life cycle.
From vertical integration to specialisation
Until the late 1980s, the industry was vertically integrated. Its growing sophistication then encouraged specialisation and allowed the emergence of an industrial model where fabless or fab-lite68 companies focusing on the upstream activity of chip design to coexist with independent contractors or “foundries” which then took charge of the chip manufacturing. This model has many advantages: it lowers barriers to entry upstream of the value chain, allows fabless companies, such as Nvidia, to allocate a maximum of resources to R&D rather than capital expenditure, and foundries, such as TSMC, to benefit from the returns to scale specific to capital-intensive industries.
Capital expenditure in the sector is indeed colossal: data published by the main listed companies show that they spent respectively €53 and €61 billion on R&D and Capex in 2019, i.e. 16 and 18% of their annual turnover on average.
In order to identify the main companies in the value chain, we have divided the semiconductor industry into five segments:
- integrated device manufacturers, which design, manufacture and market semiconductors;
- fabless companies, which design and market semiconductors and subcontract manufacturing to independent manufacturers;
- foundries, which are independent contractors specialising in the production of chips for their fabless customers;
- equipment manufacturers, which sell equipment used in the semiconductor manufacturing process; and
- electronic design automation companies, which provide chip designers with assisted design software.
The main listed companies in these five segments are identified on the map below thanks to the location of their headquarters and their market capitalisation which is a good indicator of their future weight in the industry as it reflects the future profits anticipated by investors. It is important to bear in mind that this map represents only a part, albeit a significant but non- exhaustive part, of the sector because it does not include private companies (such as GlobalFoundries in the U.S. or HiSilicon in China) and conglomerates with a semiconductor business, such as Korea’s Samsung or Japan’s Hitachi, Matsushita, Mitsubishi, Fujitsu, Toshiba and Sony. We can therefore consider that our sample significantly underestimates Asian weight in the industry. In spite of this bias, we can see that Europe is nonetheless clearly overtaken by Asia and the United States, with companies whose aggregated market capitalisation is respectively twice and five times lower.
Each disc focuses on the location of the headquarters of the main listed companies in the semiconductor value chain. The surface area of a disc is proportional to the market capitalisation of the company concerned (as of 12 July 2020), while its colour indicates the market segment to which the company belongs. The black circles correspond to the sum of the regional market capitalisations. A list of the companies represented can be found in Appendix A (page 43).
The global semiconductor value chain
© Fondation pour l’innovation politique, November 2020.
Source: Author’s calculations; Reuters data.
Besides, a sectoral analysis shows that the value does not lie in a particular segment of the market but in the specialisation along these various segments, whether it be in industrial equipment (ASML), design software (Cadence, Synopsys), manufacturing (TSMC) or chip design (AMD, Broadcom, Nvidia). The low valuation of Intel – the only vertically integrated company in the industry’s top five market capitalisations – as measured by the price-to-earnings (P/E) ratio, underscores that investors also perceive the relevance of a high degree of specialisation.
Key figures for the top five market capitalisations in the semiconductor industry in the world
Copyright :
© Fondation pour l’innovation politique, November 2020.
Source :
Author’s calculations.
Historically, the increase in the size of wafers, driven in particular by Intel, has been one of the key factors in reducing costs and increasing the productivity of fabs. Currently, 23 semiconductor producers have fabs capable of processing 300 mm wafers, while 58 still operate with 200 mm wafers. However, the industrial concentration is such that 300 mm technology accounts for more than two-thirds of the installed See Joel Hruska, “450mm silicon wafers aren’t happening any time soon as major consortium collapses“, extremetech.com, 13 January 2017.
Concentration of production sites in Asia
What about semiconductor manufacturing plants (fabs)? First of all, one must have in mind that they are among the most automated factories in the world. Several chips are simultaneously assembled by sophisticated equipment on thin silicon wafers. The manufacturing process is extremely capital-intensive and the construction of a fab to current industry standards requires an initial investment of around 10 billion dollars.
Several technological parameters make it possible to distinguish fabs from one another:
- the maximum size of wafers that the plant is capable of processing (typically 100-300 mm)69;
- production capacity (often measured in number of wafers per month);
- the manufacturing process, which varies from one fab to another depending on their technological maturity and the type of semiconductors produced (the 7 and 5 nm nodes being the most cutting-edge today).
We have been able to locate the fabs currently in operation around the world thanks to a database accessible on Wikipedia. Their cartography shows a high concentration of production sites in Asia, particularly in Taiwan and Japan. In the absence of sufficiently exhaustive data, it was not possible to “weigh” the geolocation data with variables such as production capacity or the degree of technological sophistication of the fabs. Nevertheless, given the position of TSMC (Taiwan) and Samsung (South Korea) in the industry, it is highly likely that the weight of Asia would have been even greater.
The heat map shows the location of the fabs referenced in the Wikipedia database (link below). No weighting is applied to the geolocation data of the production sites because it is not possible to rank all production units according to unique objective criteria such as production capacity or production technology.
Location of the semiconductor manufacturing facilities (fabs) around the world
© Fondation pour l’innovation politique, November 2020.
Source: Wikipedia
Morris Chang, interview conducted for the SEMI and the Computer History Museum, org, 24 August 2017.
The European continent thus appears to be overtaken by the United States, Japan, South Korea and Taiwan in the field of semiconductors, both in terms of innovation capabilities and production capacities.
However, ASML is a notable exception in the European landscape. Founded in 1984 as a joint venture between the Dutch companies ASM International and Philips, ASML is today the world’s leading manufacturer of EUV (extreme ultraviolet) photolithography equipment.
Its machines, which are used by the major semiconductor manufacturers, make it possible to optimise the manufacturing of integrated circuits. Long before its emergence as a reference technology for the production of the latest generations of semiconductors, ASML believed in the potential of the “EUV” process and was able to bring it to industrial maturity thanks to significant capital backing. With an undisputed technological lead and considerable growth potential, ASML today has a market capitalisation of nearly €150 billion which rivals that of the world giants in the sector despite an annual turnover of only €12 billion at this stage.
Finally, the history of the giant Taiwan Semiconductor Manufacturing Corporation (TSMC) deserves to be studied as it may prove rich lessons for Europe. The genesis of the company dates back to the mid-1980s, when the Taiwanese authorities wanted to develop expertise in semiconductors. Morris Chang, an industry veteran who rose through the ranks at Texas Instruments (TI) and then General Instrument in the United States, was asked to develop a national strategy. Acknowledging Taiwan’s industrial backwardness in the industry and the limits of national resources, his conviction was that it would be futile to try to compete with the American giants on chip design. As a pragmatic businessman, he then looked for a niche that would potentially allow him to develop a viable business70. His intuition came from observations made during his three decades in the industry: “When I was at TI and General Instrument, I saw a lot of IC designers wanting to leave and set up their own business, but the only thing, or the biggest thing that stopped them from leaving those companies was that they couldn’t raise enough money to form their own company. Because at that time, it was thought that every company needed manufacturing, needed wafer manufacturing, and that was the most capital intensive part of a semiconductor company, of an IC company. And I saw all those people wanting to leave, but being stopped by the lack of ability to raise a lot of money to build a wafer fab. So I thought that maybe TSMC, a pure-play foundry, could remedy that.”
The giants of the time, such as Intel, TI or Motorola, were already offering outsourcing services, but these were undeveloped, expensive and not trusted because of the potential conflict of interest (their customers being potential competitors). In 1987, the creation of TSMC by Morris Chang (who remained its CEO until June 2005) marked the beginning of the independent contractor model in the semiconductor industry. The latter will play a key role in the emergence of the fabless model, which will allow the arrival of new players on the market. For example, today’s industry leader Nvidia was launched in 1993 with only 20 million dollars. Morris Chang’s tour de force was to believe in the possibility of the emergence of an alternative production model which would quickly satisfy – and would subsequently grow – on a latent need.
The history of TSMC thus teaches us some of the key success factors of industrial policy:
- analysing one’s own strengths and weaknesses with lucidity;
- early positioning on promising niches within existing international value chains in order to develop specific and differentiating skills, products and services; and
- building on the skills of industry professionals and entrusting them with the reins of the projects.
In sum, the examples of the semiconductor industry show that there is no single model for success but an imperative for hyper-specialisation in the value chain. Seeking to build a European replica of TSMC would probably not make much sense today, just as it would have been unwise to copy the Texas Instruments model when TSMC was founded in the 1980s.
The cloud industry
See Synergy, “Cloud Service Spending Still Growing Almost 40% per Year; Half of it Won by Amazon & Microsoft”, srgresearch.com, 26 July 2019 (www.srgrescom/articles/cloud-service-spending-still-), and also, “Half-Yearly Review Shows $150 billion Spent on Cloud Services and Infrastructure“, srgresearch. com, 19 September 2019.
We have deliberately excluded the telecommunications segment, which is crucial to the operation of data centres and the Internet economy, but which deserves to be treated separately.
Cloud giants are particularly fond of this second approach, allowing them to fine-tune servers to their needs and order in very large quantities.
See Ron Miller, “Cloud spending said to top $30B in Q4 as Amazon, Microsoft battle for market share“, com, 19 February 2020.
The cloud industry covers a wide range of products, equipment and services for hosting web services, data storage and computing in remote data centres. It is currently one of the most dynamic technology markets, with annual revenue growth of 20% and 40% respectively in cloud services and infrastructure71.
For the purposes of this analysis, we have broken down the cloud value chain into six segments, from the most upstream to the most downstream72:
- electronic components’ manufacturers: upstream of the value chain are manufacturers of components such as hard disks and random access memory (e.g. Hitachi, Toshiba, Western Digital, Seagate, Samsung Electronics), processors and graphics cards (e.g. Intel, Nvidia, AMD) or routers and network switches (e.g. Cisco Systems, Juniper Networks, Arista Networks);
- servers and software for data centres: the components are assembled by specialised companies which either market the servers under their own brand name (“OEMs” for original equipment manufacturers such as HP Enterprise, Dell, Lenovo, IBM or Inspur), or assemble them to measure for their customers and sell them under a white label (“ODMs” for original design manufacturers such as Foxconn)73.
OEMs also generally develop and sell administration, supervision, hyper- vision and virtualisation software used in data centres (IBM with RedHat, Dell with VMWare, etc.). Other players are exclusively specialised in one of these software segments (such as Nutanix or Datadog, for example);
- Cybersecurity hardware and software: data centres are protected by cybersecurity equipment such as physical or virtual firewalls, VPNs for remote connection to a network, access point protection systems or antivirus software. The big names in this segment are Cisco Systems, Palo Alto Networks, Fortinet, Fireye, NortonLifeLock, Avast, ;
- Landlords and facility managers: servers are physically installed in large warehouses called data centres, which require particularly robust and resilient cooling and power supply systems, as well as an excellent network connection. Some real estate companies have specialised in the construction, leasing and operation of these data centres on behalf of third Examples include Equinix, Digital Realty and CoreSite. Many telecommunications companies also offer these types of services, such as NTT Communications in Japan. Web giants are important customers of these companies: a dive into Amazon’s annual report shows that the company only owns one third of its total data centre capacity, with the remaining two-thirds being leased;
- Cloud providers: the flagship segment of this market is that of cloud service This is an oligopolistic market with a few players, known as hyperscalers, who hold the bulk of global market share: Amazon via AWS (32% market share74), Microsoft via Azure (18%), Google via Google Cloud (6%) or Alibaba via Alibaba Cloud (5%). These companies either rent out cloud infrastructures (hard disks, servers, etc.) that they manage or add a level of abstraction by selling services directly (computing capacity, web hosting, etc.);
- Internet software and services companies (SaaS): these are companies that operate the services of cloud providers. They include companies offering their services to individuals (B2C), such as Facebook, Spotify, Booking or Zalando, or to businesses (B2B), such as SAP, Salesforce or Some of these companies use the services of hyperscalers, such as Spotify which is hosted at Google Cloud or Atlassian at AWS, while others do without their services and own or lease capacity directly in data centres, such as Booking or ServiceNow which have leases with Equinix. Finally, it should be noted that the major cloud providers are also present in the online services segment: Amazon, Microsoft, Google or Alibaba were not cloud hosting providers in their early days and continue to generate the bulk of their turnover via their online services activities.
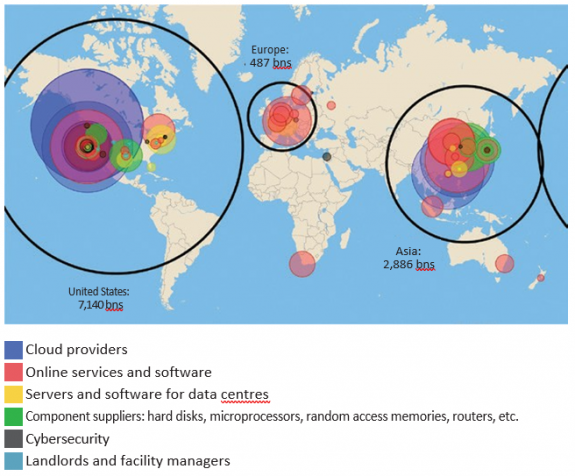
The following data visualisation shows the main listed companies belonging to these six segments. For the SaaS segment, we have only included market capitalisations in excess of €10 billion. Private companies such as Huawei or Airbnb are by default excluded from the sample.
Each disk is centred on the location of the headquarters of the main listed companies of the cloud value chain. The surface area of a disc is proportional to the market capitalisation of the company (as of 12 July 2020), while its colour indicates the market segment to which the company belongs. The black circles correspond to the sum of the regional market capitalisations. A list of the companies represented can be found in Appendix B (page 44).
The global cloud value chain
© Fondation pour l’innovation politique, November 2020.
Source: Author’s calculations.
These high value-added services include, for example, optimised calculation capacities for artificial intelligence, image or sound recognition services, or database management services.
Less than 1% global market share for See Antoine Crochet-Damais, “Après deux ans à marche forcée, OVH lève le pied“, journaldunet.com, 7 June 2019.
See Sophy Caulier, “Numérique : le cloud, enjeu de souveraineté”, Le Monde, 16 February 2020.
Capex of the top twenty cloud and Internet companies (Amazon, Google, Microsoft, Facebook, Apple, Alibaba, Baidu, IBM, etc). See Synergy, “Hyperscale Operator Spending on Data Centers up 11% in 2019 Despite only Modest Capex Growth“, srgresearch.com, 24 March 2020.
Worrisome prospects for Europe
The mapping leads to one clear conclusion: Europe is lagging far behind the United States and Asia in the cloud industry. The market capitalisation of the main American cloud-related companies is fifteen times greater than that of their European counterparts. Moreover, their European competitors focus almost exclusively on the downstream end of the value chain, in online services and software (SaaS), where only a handful of companies, such as SAP (whose emergence preceded that of the cloud industry), Spotify and Adyen, stand out.
This is all the more worrying as the industry is experiencing exceptional growth and is characterised by multiple barriers to entry throughout the value chain due to its high capital intensity (R&D and Capex) and network effects.
So what kind of strategies could be envisaged to “localise” the value chain and value creation in Europe? The market capitalisations of the sector highlighted on the map by the size of the disks show that most of the potential for value creation lies in the “downstream” segments, i.e. in cloud provision (purple disks) and Internet services and software (red disks). So let’s now consider these two verticals.
Cloud Provisioning
Cloud provisioning is an extremely capital-intensive activity due to the cost of purchasing electronic equipment, such as servers, routers, hard disks, etc. In addition, as the industry is moving away from the simple business of servers’ rental (the so-called “bare-metal cloud” segment) towards the provision of high value-added services, the R&D costs of these activities75 add up to the cost of acquiring electronic equipment. For this reason, the odds of smaller rivals like OVHcloud catching up of hyperscalers such as Amazon (AWS), Microsoft (Azure) or Google (Google Cloud) are very low76.
The €250 million invested by the French government in the sovereign cloud project since 201177 pales in comparison to the $32 billion allocated by market leaders in capital expenditure alone in the last quarter of 201978. In order to exist alongside the giants in global competition, small companies like OVHcloud therefore have every interest in specialising in a niche value proposition such as hosting the data of French companies or administrations that do not wish to use the services of foreign companies. The recently presented European GAIA-X project is in line with this logic: it aims to compete with hyperscalers not by creating a European champion but by developing interoperability and portability standards to better “interface” the services of relatively niche companies positioned on specific segments.
Online services and software (SaaS)
In the online services and software segment, the situation is no better. With too rare exceptions, Europe has no leading tech companies in this field. However, this segment is characterised by lower capital requirements, given the possibility of leasing access to quality IT infrastructure from the cloud giants. It is therefore more plausible that European competitors to the U.S. leaders will emerge in this part of the value chain, although this is not obvious given the network and usage effects characteristic of the digital sector.
Hence, positioning on the downstream segment of the cloud industry is likely to be the most credible option to curb our growing dependence on the United States. By creating more value downstream in the value chain, Europe could rebalance what are today almost one-way trade relations. Mutual dependency is probably one of the best trade defence strategies, as neither side has an interest in unilaterally severing the relationship.
The examples of the semiconductor and cloud industries thus illustrate Europe’s chronic inability to develop leading companies in digital technologies, with a few notable exceptions. Catch-up strategies are conceivable, but they would require considerable investment in R&D and Capex to even attempt to replicate what already exists elsewhere, with the risk of falling even further behind if this were to be done at the expense of resources dedicated to innovation. Therefore, the best approach is probably to seek integrating into existing value chains by targeting niche markets and technologies that could become central in the future. This has been the key to ASML’s success in the semiconductors industry, one of the few European success stories in digital technologies that could inspire others.
Industrial reshoring, understood as the repatriation of production formerly carried out on our soil, should remain limited to special cases, for compelling reasons and in the absence of more effective alternatives. As a society, we could for instance agree to subsidise redundant production lines for basic goods that may be in great demand in times of crisis, such as protective masks or certain drugs.
We have also illustrated with the examples of the semiconductor and cloud industries that if there is one sector in which Europe is clearly lagging behind and is in fact caught up in relations of dependence that could prove problematic, it is undoubtedly that of digital technologies.
Therefore, our human and financial resources (by essence limited) should primarily be directed towards the objective of closing this gap thanks to the creation and development of new niche and value-creating businesses in this area. From a political point of view, the objective would then not be the reshoring (“relocation”) of old industries but the “location” of various future activities. This is indeed where the future employment pools and the technologies which will determine the competitiveness of European companies and the balance of power between the world’s leading countries are to be found.
Listed companies in the global semiconductor value chain.
Asia
Advantest, ASM Pacific Technology, Dainippon Screen, Lasertech, MediaTek, Nuvoton, Renesas, Shanghai Belling, SK Hynix, SMIC, Tokyo Electron, TSMC, Unigroup Guoxin, United Microelectronics, VIS, Winbond, Zuken.
United States
AMD, Analog Devices, Applied Materials, Broadcom, Cadence, Intel, KLA- Tencor, Lam Research, Lattice Semiconductor, Marvell, Maxim Integrated, Microchip, Micron, Nvidia, ON Semiconductor, Qorvo, Qualcomm, Synopsys, Teradyne, Texas Instruments, Xilinx.
Europe
AMS AG, ASM International, ASML, Infineon, NXP, STMicroelectronics, X-Fab.
Other regions of the world
Tower Semiconductor (Israel).
Listed companies retained in the global cloud value chain.
Asia
Alibaba, Baidu, Foxconn, Hitachi, Inspur, Inventec, JD.com, Lenovo, Meituan- Dianping, Naver, Netease, NTT Communications, Pinduoduo, Rakuten, Recruit Holdings, Samsung Electronics, Sea Limited, SK Hynics, Sony, Suning, Tencent, Toshiba, Trend Micro, Trip.com, WiWynn.
United States
Adobe, Amazon, AMD, Arista Networks, Booking, Cisco Systems, Citrix, Copart, Copt (Corporate Office Properties Trust) Data center, Coresite, CrowdStrike, Cyberark, CyrusOne, Datadog, Dell Technologies, Digital Realty, DocuSign, Dropbox, eBay, Equinix, Expedia, F5 Networks, Facebook, Fireye, Fortinet, GoDaddy, Google, HP Entreprise, IBM, Intel, Intuit, Juniper Networks, Lyft, Match Group, Micron, Microsoft, NetApp, Netflix, NortonLifeLock, Nutanix, Okta, Oracle, Palo Alto Networks, Paycom Software, PayPal, Pinterest, Proofpoint, QTS Realty Trust, Qualys, Rapid7, RingCentral, Salesforce, Seagate, ServiceNow, Slack, Snap, Splunk, Square, Switch, Texas Instruments, Twilio, Twitter, Uber, Veeva Systems, VeriSign, Vertiv, Western Digital, Workday, Zoom, Zscaler.
Europe
ABB, Adyen, Avast, Dassault Systèmes, F-Secure, SAP, Schneider Electric, Spotify, Zalando.
Other regions of the world
Atlassian (Australia), Check Point Software Technologies (Israel), Naspers (South Africa), Shopify (Canada), Xero (New Zealand), Yandex (Russia).







No comments.